 Français
  Русский
 English
 Bahasa Indonesia
 Bahasa Malay
 ไทย
ไทย Español
 Deutsch
 Български
 Tiếng Việt
 中文
中文 বাংলা
বাংলা हिन्दी
 Čeština
 Українська
 Română
FX.co ★ Patterns #INTC | Intel Corporation Stock Price

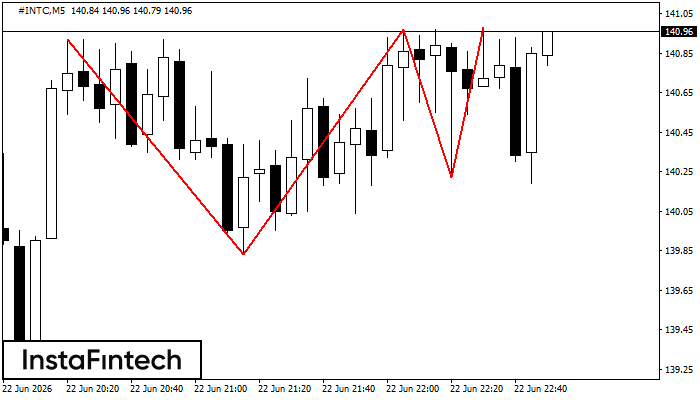
#INTC M5
Triple Top
The Triple Top pattern has formed on the chart of the #INTC M5. Features of the pattern: borders have an ascending angle; the lower line of the pattern has the coordinates 139.83/140.22 with the upper limit 140.92/140.98; the projection of the width is 109 points. The formation of the Triple Top figure most likely indicates a change in the trend from upward to downward. This means that in the event of a breakdown of the support level of 139.83, the price is most likely to continue the downward movement.
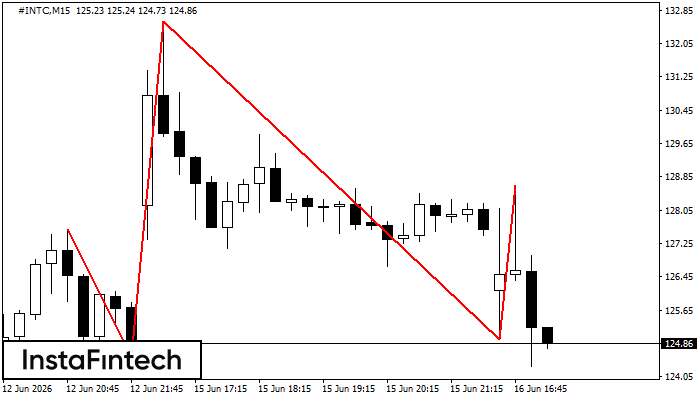
#INTC M15
Head and Shoulders
The #INTC M15 formed the Head and Shoulders pattern with the following features: The Head’s top is at 132.57, the Neckline and the upward angle are at 124.55/124.94. The formation of this pattern can bring about changes in the current trend from bullish to bearish. In case the pattern triggers the expected changes, the price of #INTC will go towards 124.71.
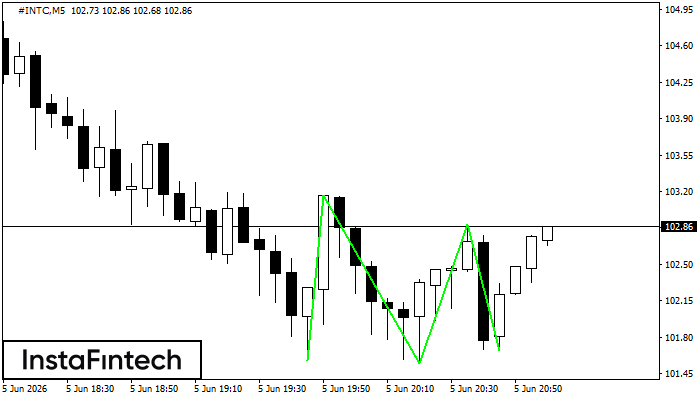
#INTC M5
Triple Bottom
The Triple Bottom pattern has been formed on #INTC M5. It has the following characteristics: resistance level 103.16/102.88; support level 101.58/101.67; the width is 158 points. In the event of a breakdown of the resistance level of 103.16, the price is likely to continue an upward movement at least to 101.70.
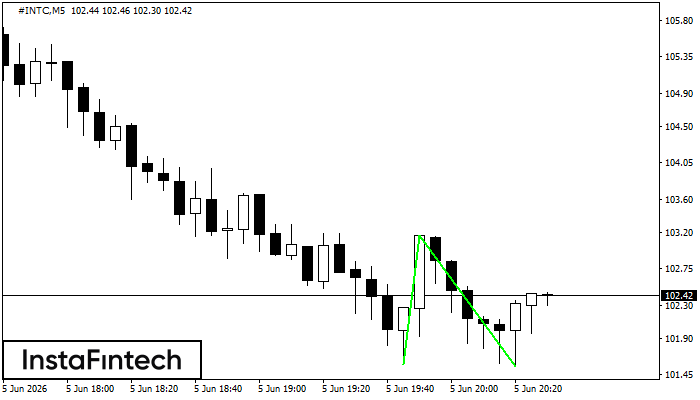
#INTC M5
Double Bottom
The Double Bottom pattern has been formed on #INTC M5. Characteristics: the support level 101.58; the resistance level 103.16; the width of the pattern 158 points. If the resistance level is broken, a change in the trend can be predicted with the first target point lying at the distance of 161 points.
#INTC M5
Double Bottom
The Double Bottom pattern has been formed on #INTC M5. This formation signals a reversal of the trend from downwards to upwards. The signal is that a buy trade should be opened after the upper boundary of the pattern 119.24 is broken. The further movements will rely on the width of the current pattern 158 points.
#INTC M5
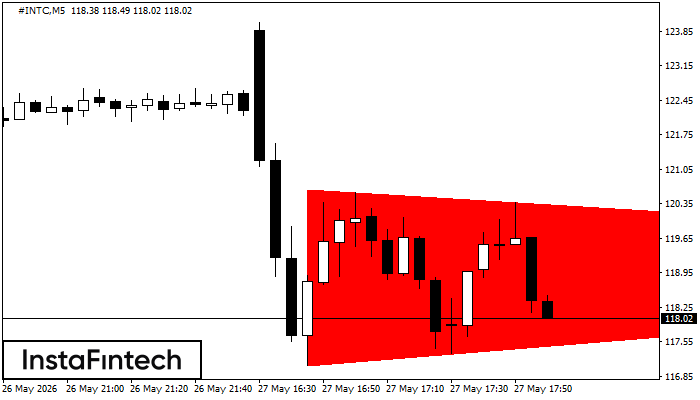
Bearish Symmetrical Triangle
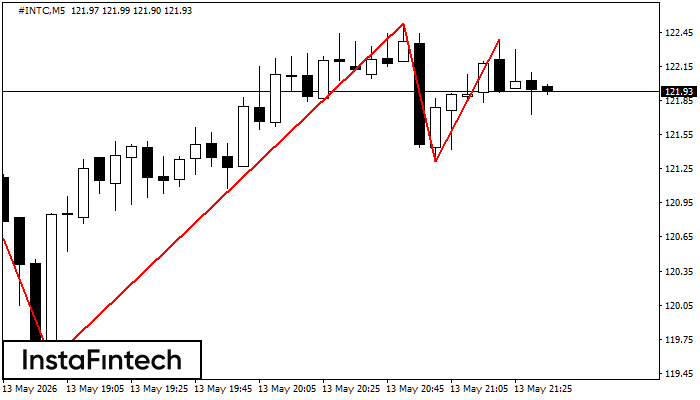
According to the chart of M5, #INTC formed the Bearish Symmetrical Triangle pattern. This pattern signals a further downward trend in case the lower border 117.07 is breached. Here, a hypothetical profit will equal the width of the available pattern that is -357 pips.
#INTC M15
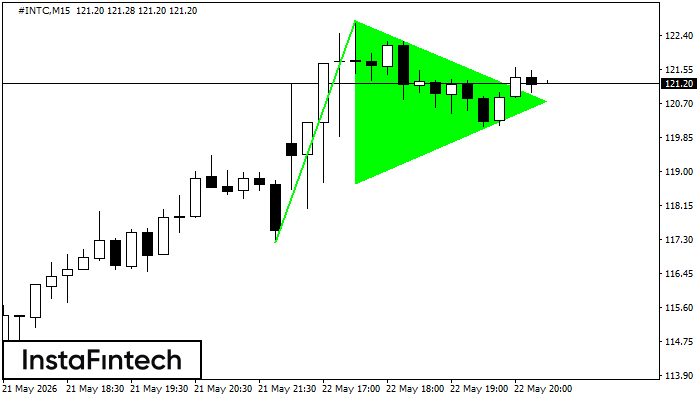
Bullish pennant
The Bullish pennant signal – Trading instrument #INTC M15, continuation pattern. Forecast: it is possible to set up a buy position above the pattern’s high of 122.79, with the prospect of the next move being a projection of the flagpole height.
#INTC M15
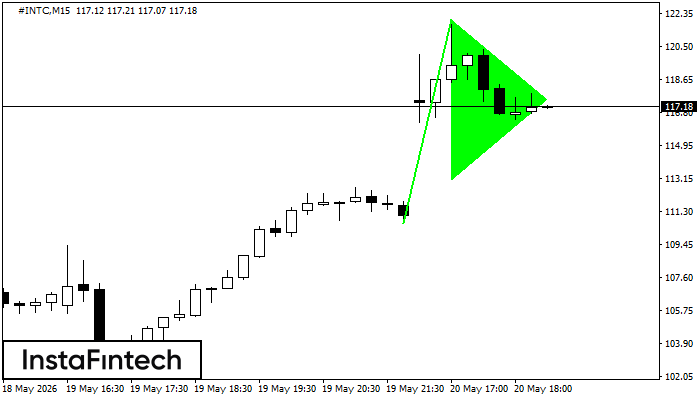
Bullish pennant
The Bullish pennant graphic pattern has formed on the #INTC M15 instrument. This pattern type falls under the category of continuation patterns. In this case, if the quote can breaks out high, is expected to continue the upward trend to level 122.26.
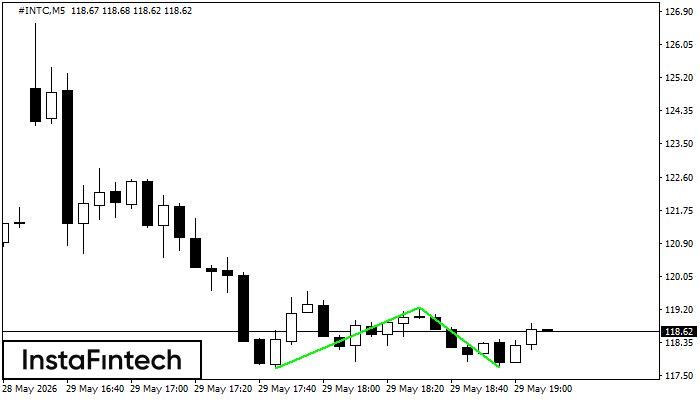
#INTC M5
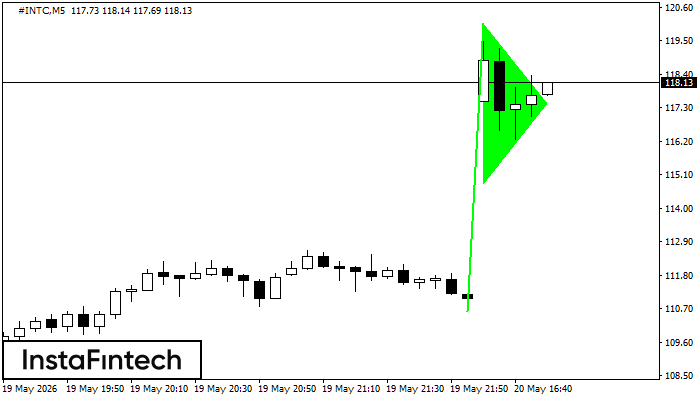
Bullish pennant
The Bullish pennant signal – Trading instrument #INTC M5, continuation pattern. Forecast: it is possible to set up a buy position above the pattern’s high of 120.07, with the prospect of the next move being a projection of the flagpole height.
#INTC M5
Triple Top
On the chart of the #INTC M5 trading instrument, the Triple Top pattern that signals a trend change has formed. It is possible that after formation of the third peak, the price will try to break through the resistance level 119.56, where we advise to open a trading position for sale. Take profit is the projection of the pattern’s width, which is 322 points.