 Français
  Русский
 English
 Bahasa Indonesia
 Bahasa Malay
 ไทย
ไทย Español
 Deutsch
 Български
 Tiếng Việt
 中文
中文 বাংলা
বাংলা हिन्दी
 Čeština
 Українська
 Română
FX.co ★ Patterns #MA | Mastercard IncorpoRated Stock Price

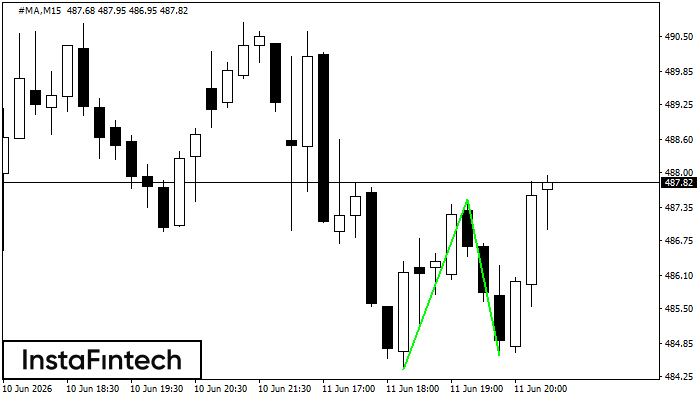
#MA M15
Double Bottom
The Double Bottom pattern has been formed on #MA M15. Characteristics: the support level 484.37; the resistance level 487.50; the width of the pattern 313 points. If the resistance level is broken, a change in the trend can be predicted with the first target point lying at the distance of 287 points.
#MA M15
Bullish pennant
The Bullish pennant pattern is formed on the #MA M15 chart. It is a type of the continuation pattern. Supposedly, in case the price is fixed above the pennant’s high of 489.70, a further uptrend is possible.
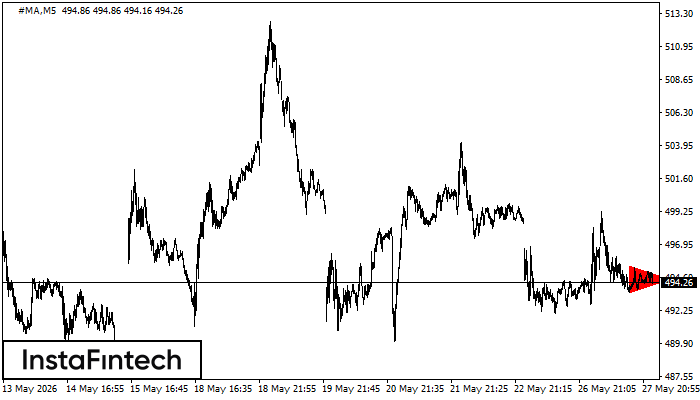
#MA M5
Bearish Symmetrical Triangle
According to the chart of M5, #MA formed the Bearish Symmetrical Triangle pattern. Description: The lower border is 493.54/494.48 and upper border is 495.44/494.48. The pattern width is measured on the chart at -190 pips. The formation of the Bearish Symmetrical Triangle pattern evidently signals a continuation of the downward trend. In other words, if the scenario comes true and #MA breaches the lower border, the price could continue its move toward 494.33.
#MA M5
Double Top
On the chart of #MA M5 the Double Top reversal pattern has been formed. Characteristics: the upper boundary 497.96; the lower boundary 496.46; the width of the pattern 150 points. The signal: a break of the lower boundary will cause continuation of the downward trend targeting the 496.31 level.
#MA M5
Triple Top
On the chart of the #MA M5 trading instrument, the Triple Top pattern that signals a trend change has formed. It is possible that after formation of the third peak, the price will try to break through the resistance level 504.17, where we advise to open a trading position for sale. Take profit is the projection of the pattern’s width, which is 178 points.
#MA M5
Double Top
The Double Top pattern has been formed on #MA M5. It signals that the trend has been changed from upwards to downwards. Probably, if the base of the pattern 504.17 is broken, the downward movement will continue.
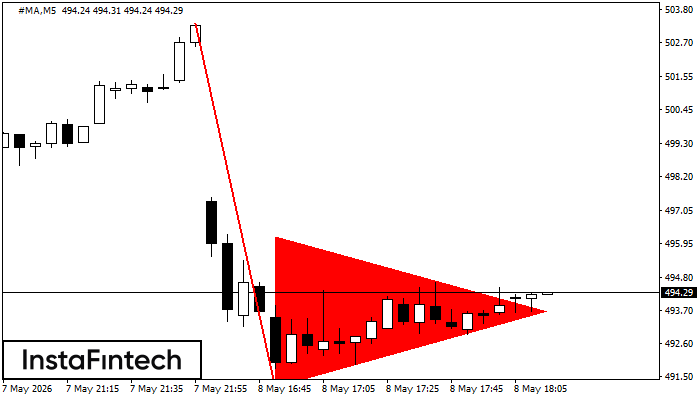
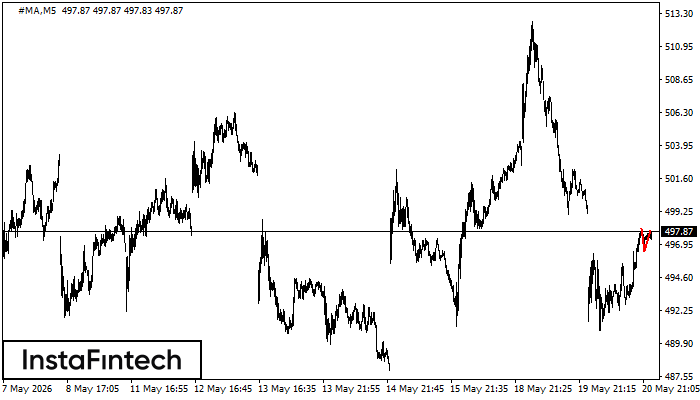
#MA M5
Bearish pennant
The Bearish pennant pattern has formed on the #MA M5 chart. It signals potential continuation of the existing trend. Specifications: the pattern’s bottom has the coordinate of 491.12; the projection of the flagpole height is equal to 1222 pips. In case the price breaks out the pattern’s bottom of 491.12, the downtrend is expected to continue for further level 490.97.
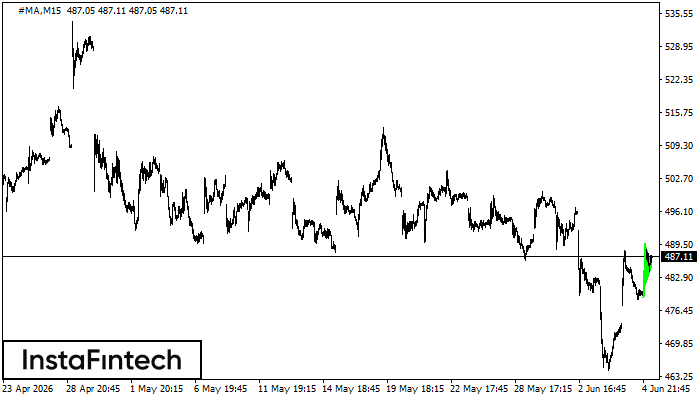
#MA H1
Double Bottom
The Double Bottom pattern has been formed on #MA H1; the upper boundary is 527.40; the lower boundary is 496.09. The width of the pattern is 3221 points. In case of a break of the upper boundary 527.40, a change in the trend can be predicted where the width of the pattern will coincide with the distance to a possible take profit level.
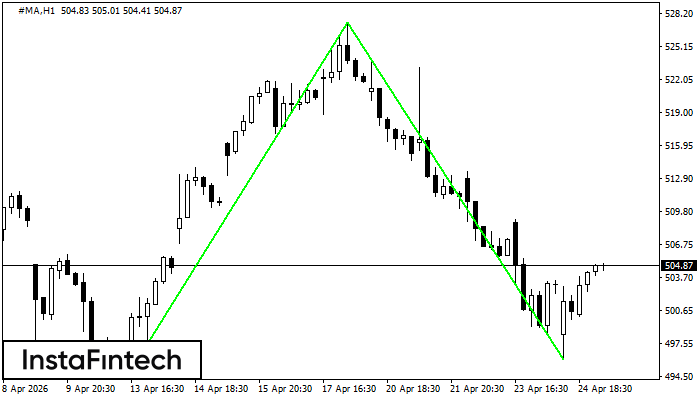
#MA H1
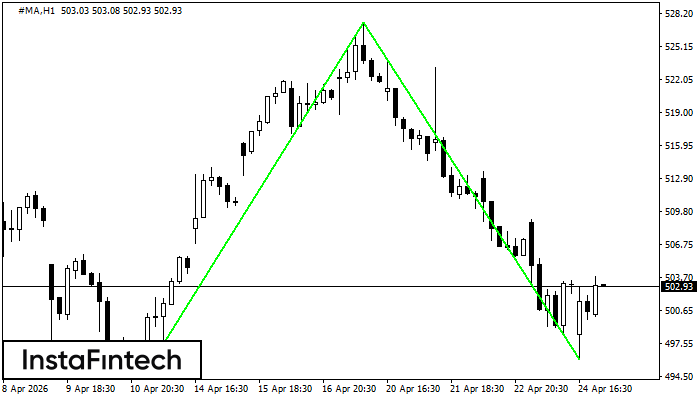
Double Bottom
The Double Bottom pattern has been formed on #MA H1. Characteristics: the support level 495.19; the resistance level 527.40; the width of the pattern 3221 points. If the resistance level is broken, a change in the trend can be predicted with the first target point lying at the distance of 3131 points.
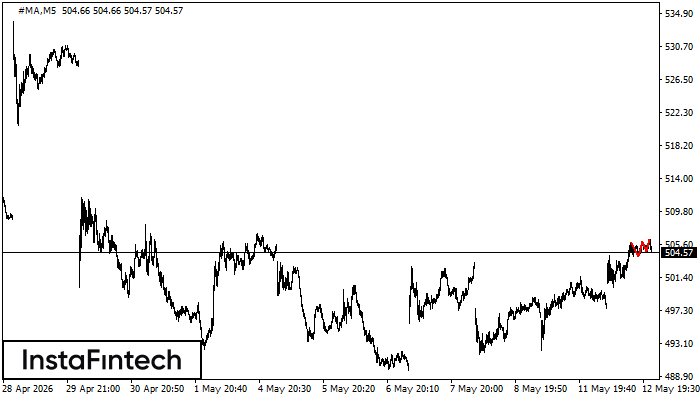
#MA M5
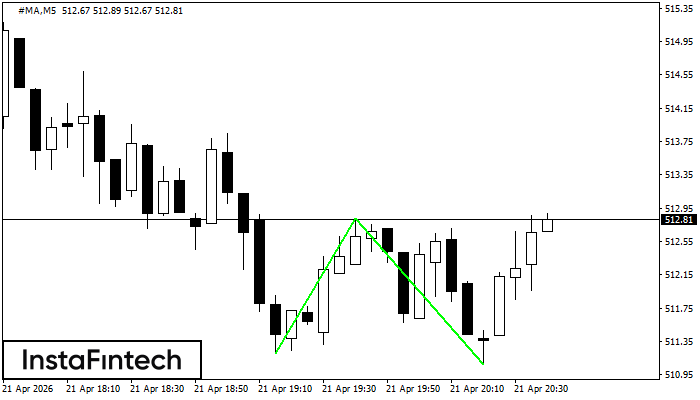
Double Bottom
The Double Bottom pattern has been formed on #MA M5. This formation signals a reversal of the trend from downwards to upwards. The signal is that a buy trade should be opened after the upper boundary of the pattern 512.82 is broken. The further movements will rely on the width of the current pattern 161 points.