 Français
  Русский
 English
 Bahasa Indonesia
 Bahasa Malay
 ไทย
ไทย Español
 Deutsch
 Български
 Tiếng Việt
 中文
中文 বাংলা
বাংলা हिन्दी
 Čeština
 Українська
 Română
FX.co ★ Patterns NZDCHF | New Zealand Dollar (NZD) to Swiss Franc (CHF) Rate in the Forex market


NZDCHF M30
Double Top
The Double Top reversal pattern has been formed on NZDCHF M30. Characteristics: the upper boundary 0.4738; the lower boundary 0.4730; the width of the pattern is 7 points. Sell trades are better to be opened below the lower boundary 0.4730 with a possible movements towards the 0.4700 level.

NZDCHF M5
Bullish Symmetrical Triangle
According to the chart of M5, NZDCHF formed the Bullish Symmetrical Triangle pattern. The lower border of the pattern touches the coordinates 0.4730/0.4734 whereas the upper border goes across 0.4738/0.4734. If the Bullish Symmetrical Triangle pattern is in progress, this evidently signals a further upward trend. In other words, in case the scenario comes true, the price of NZDCHF will breach the upper border to head for 0.4749.

NZDCHF H1
Bullish Symmetrical Triangle
According to the chart of H1, NZDCHF formed the Bullish Symmetrical Triangle pattern, which signals the trend will continue. Description. The upper border of the pattern touches the coordinates 0.4739/0.4726 whereas the lower border goes across 0.4709/0.4726. The pattern width is measured on the chart at 30 pips. If the Bullish Symmetrical Triangle pattern is in progress during the upward trend, this indicates the current trend will go on. In case 0.4726 is broken, the price could continue its move toward 0.4766.

NZDCHF H1
Bullish Symmetrical Triangle
According to the chart of H1, NZDCHF formed the Bullish Symmetrical Triangle pattern. Description: This is the pattern of a trend continuation. 0.4739 and 0.4709 are the coordinates of the upper and lower borders respectively. The pattern width is measured on the chart at 30 pips. Outlook: If the upper border 0.4739 is broken, the price is likely to continue its move by 0.4766.

NZDCHF M5
Triple Bottom
The Triple Bottom pattern has been formed on NZDCHF M5. It has the following characteristics: resistance level 0.4745/0.4741; support level 0.4738/0.4739; the width is 7 points. In the event of a breakdown of the resistance level of 0.4745, the price is likely to continue an upward movement at least to 0.4753.

NZDCHF M15
Bullish Flag
The Bullish Flag pattern has been formed on the chart NZDCHF M15 which signals that the upward trend will continue. Signals: а break of the peak at 0.4729 may push the price higher, and the rise will be the projection of the pole.

NZDCHF M15
Bullish pennant
The Bullish pennant signal – Trading instrument NZDCHF M15, continuation pattern. Forecast: it is possible to set up a buy position above the pattern’s high of 0.4729, with the prospect of the next move being a projection of the flagpole height.

NZDCHF M5
Double Bottom
The Double Bottom pattern has been formed on NZDCHF M5. Characteristics: the support level 0.4704; the resistance level 0.4707; the width of the pattern 3 points. If the resistance level is broken, a change in the trend can be predicted with the first target point lying at the distance of 3 points.

NZDCHF M30
Bullish Symmetrical Triangle
According to the chart of M30, NZDCHF formed the Bullish Symmetrical Triangle pattern. Description: This is the pattern of a trend continuation. 0.4715 and 0.4689 are the coordinates of the upper and lower borders respectively. The pattern width is measured on the chart at 26 pips. Outlook: If the upper border 0.4715 is broken, the price is likely to continue its move by 0.4731.
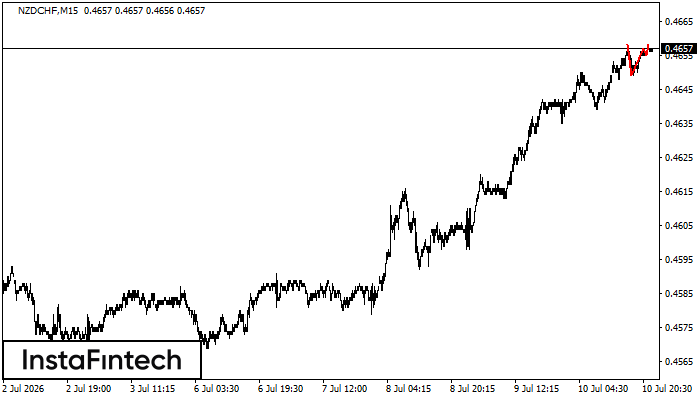
NZDCHF M15
Triple Top
On the chart of the NZDCHF M15 trading instrument, the Triple Top pattern that signals a trend change has formed. It is possible that after formation of the third peak, the price will try to break through the resistance level 0.4649, where we advise to open a trading position for sale. Take profit is the projection of the pattern’s width, which is 9 points.