 Français
  Русский
 English
 Bahasa Indonesia
 Bahasa Malay
 ไทย
ไทย Español
 Deutsch
 Български
 Tiếng Việt
 中文
中文 বাংলা
বাংলা हिन्दी
 Čeština
 Українська
 Română
FX.co ★ Patterns NZDJPY | New Zealand Dollar (NZD) to Japanese Yen (JPY) Rate in the Forex market


NZDJPY M5
Bearish Symmetrical Triangle
According to the chart of M5, NZDJPY formed the Bearish Symmetrical Triangle pattern. Description: The lower border is 94.52/94.58 and upper border is 94.67/94.58. The pattern width is measured on the chart at -15 pips. The formation of the Bearish Symmetrical Triangle pattern evidently signals a continuation of the downward trend. In other words, if the scenario comes true and NZDJPY breaches the lower border, the price could continue its move toward 94.43.

NZDJPY M5
Bullish Symmetrical Triangle
According to the chart of M5, NZDJPY formed the Bullish Symmetrical Triangle pattern. Description: This is the pattern of a trend continuation. 94.84 and 94.73 are the coordinates of the upper and lower borders respectively. The pattern width is measured on the chart at 11 pips. Outlook: If the upper border 94.84 is broken, the price is likely to continue its move by 94.94.

NZDJPY M30
Inverse Head and Shoulder
According to M30, NZDJPY is shaping the technical pattern – the Inverse Head and Shoulder. In case the Neckline 94.57/94.55 is broken out, the instrument is likely to move toward 94.85.

NZDJPY D1
Double Top
On the chart of NZDJPY D1 the Double Top reversal pattern has been formed. Characteristics: the upper boundary 95.39; the lower boundary 91.00; the width of the pattern 439 points. The signal: a break of the lower boundary will cause continuation of the downward trend targeting the 90.60 level.

NZDJPY M5
Triple Bottom
The Triple Bottom pattern has formed on the chart of the NZDJPY M5 trading instrument. The pattern signals a change in the trend from downwards to upwards in the case of breakdown of 94.83/94.81.

NZDJPY M5
Triple Top
The Triple Top pattern has formed on the chart of the NZDJPY M5. Features of the pattern: borders have an ascending angle; the lower line of the pattern has the coordinates 94.79/94.88 with the upper limit 95.01/94.94; the projection of the width is 22 points. The formation of the Triple Top figure most likely indicates a change in the trend from upward to downward. This means that in the event of a breakdown of the support level of 94.79, the price is most likely to continue the downward movement.
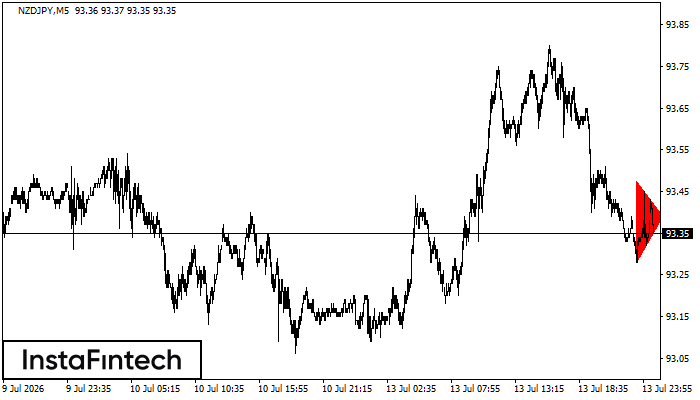
NZDJPY M5
Bearish Symmetrical Triangle
According to the chart of M5, NZDJPY formed the Bearish Symmetrical Triangle pattern. This pattern signals a further downward trend in case the lower border 93.28 is breached. Here, a hypothetical profit will equal the width of the available pattern that is -20 pips.
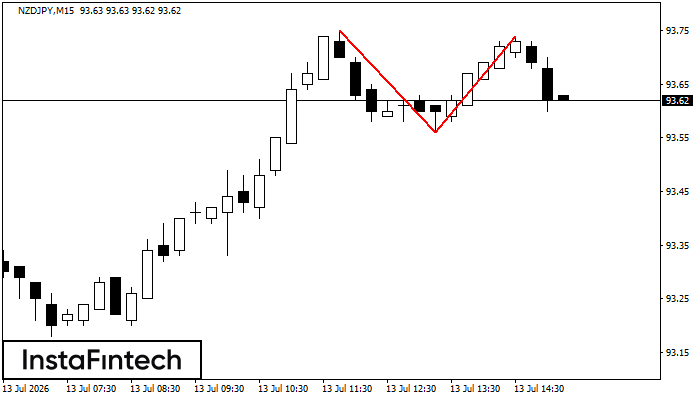
NZDJPY M15
Double Top
On the chart of NZDJPY M15 the Double Top reversal pattern has been formed. Characteristics: the upper boundary 93.74; the lower boundary 93.56; the width of the pattern 18 points. The signal: a break of the lower boundary will cause continuation of the downward trend targeting the 93.33 level.
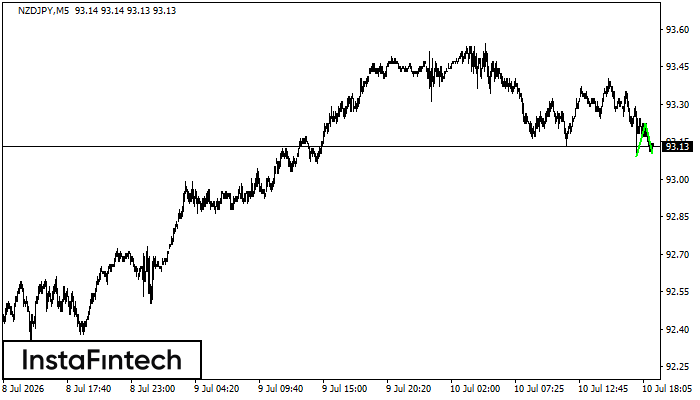
NZDJPY M5
Double Bottom
The Double Bottom pattern has been formed on NZDJPY M5. Characteristics: the support level 93.09; the resistance level 93.22; the width of the pattern 13 points. If the resistance level is broken, a change in the trend can be predicted with the first target point lying at the distance of 12 points.
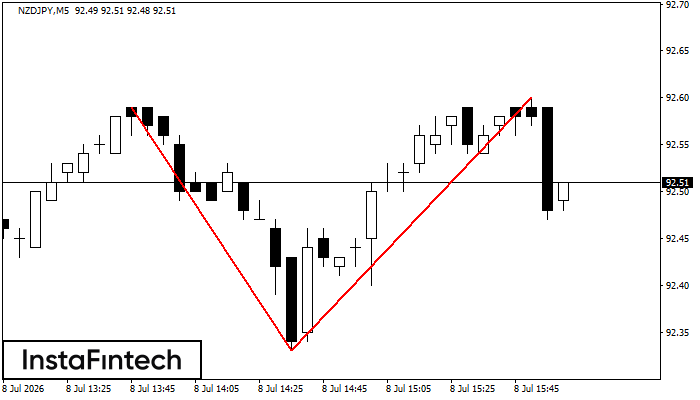
NZDJPY M5
Double Top
On the chart of NZDJPY M5 the Double Top reversal pattern has been formed. Characteristics: the upper boundary 92.60; the lower boundary 92.33; the width of the pattern 27 points. The signal: a break of the lower boundary will cause continuation of the downward trend targeting the 92.18 level.