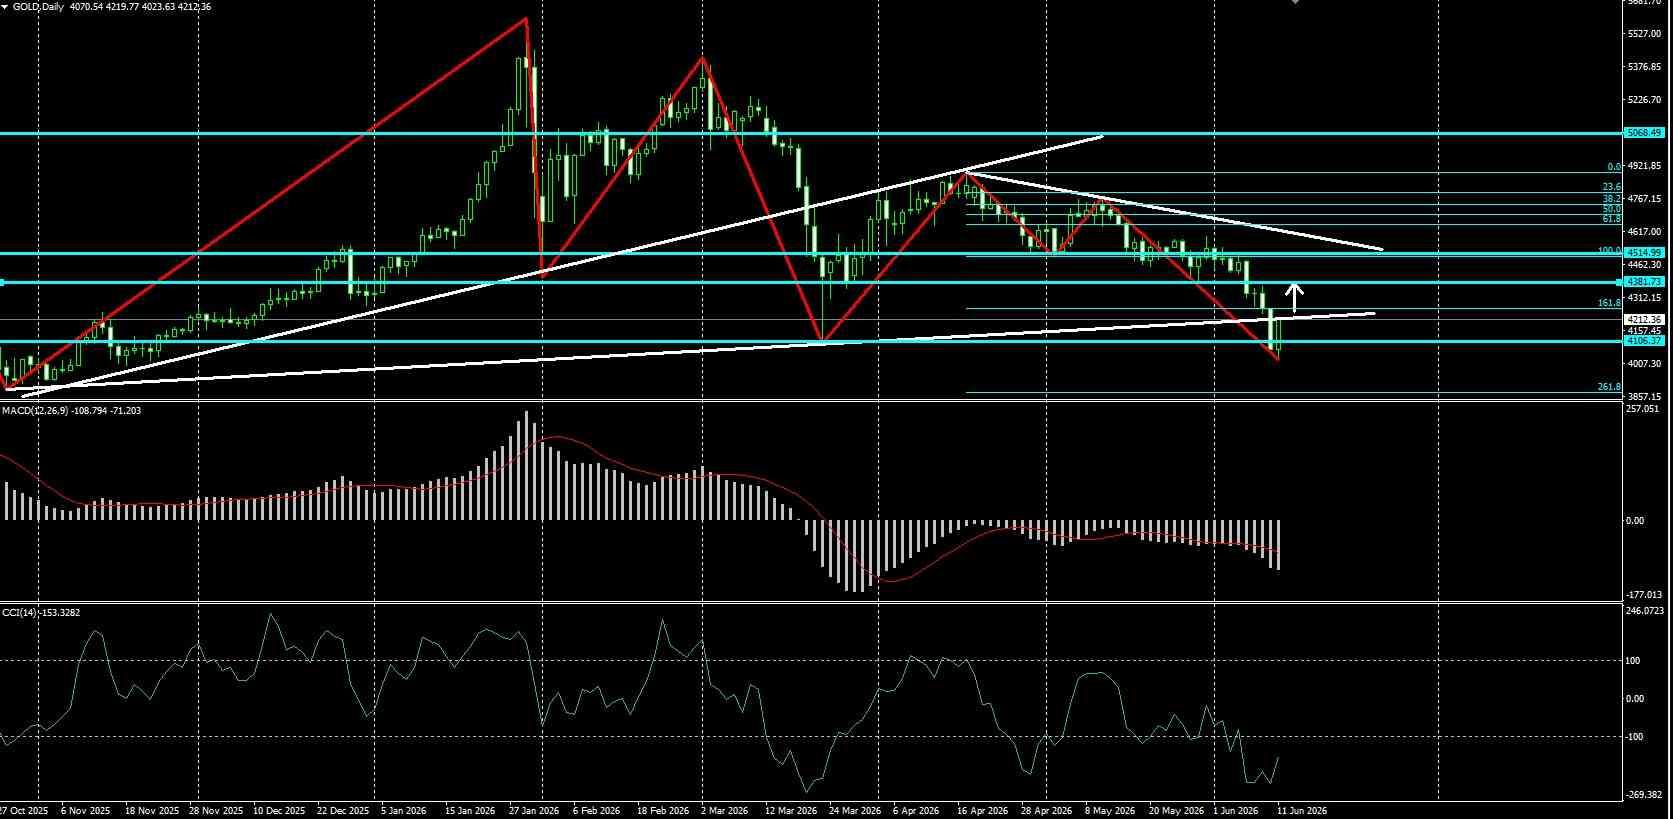
D1 chart - trading instrument GOLD. The wave structure is forming its downward sequence, the MACD indicator is in the oversold zone. At the end of last May, what seemed like the third wave down started, but something prevented the price from falling, it stopped and pushed the price back up again. Stops were taken out above the nearest peak where they are usually hidden, and now there will likely be a continuation of the third wave. Sometimes the third wave progresses smoothly, while other times there is a retracement and liquidity withdrawal. Of course, the price may move even higher, with the selling zone on lower timeframes being the descending line zone drawn from the last two wave peaks. By overlaying a Fibonacci grid on the first wave, the target can be seen at the 161.8 level. Just slightly beyond that is the main ascending support line where I believe the price will aim for. Looking at the overall market, it is evident that on higher timeframes, the scenario of the US dollar dominating in the near future of June is expected. Based on the above, I conclude that on lower timeframes within the day, it is more promising to consider only formations for selling, as they have a higher chance of a positive outcome. This should continue until the specified target of the expected decline is reached. I think it's best to avoid formations for buying for now. A breakthrough in the bearish sentiment can be considered when the price breaks above the descending line drawn from the tops of the recent rising waves. Until then, as there is no such breakout, I only consider working with the price below the line. It is clear that gold will appreciate again in the future, as there is demand for it in the world and it will not disappear. However, before reaching new historical highs, there may be a prolonged downward correction lasting for a year, for example. On Friday, June 5th, there were important news, the so-called Non-Farm Payrolls, employment data in the US. The indicators came out better than expected, as a result, the US dollar strengthened overall in the market. They almost reached the target, but the line was broken due to the significant strengthening of the dollar, they clearly wanted to break below the March low, which they succeeded in. The situation around Iran likely influences the strengthening of the dollar. It was expected that a corrective rise would occur as the area below the low is a buying zone. Additionally, the CCI is in the oversold zone. As can be seen, there is growth and potential up to the level of 4514 based on closing prices.
*The market analysis posted here is meant to increase your awareness, but not to give instructions to make a trade
 Italiano
  Русский
 English
 Bahasa Indonesia
 Bahasa Malay
 ไทย
ไทย Español
 Deutsch
 Български
 Français
 Tiếng Việt
 中文
中文 বাংলা
বাংলা हिन्दी
 Čeština
 Українська
 Română