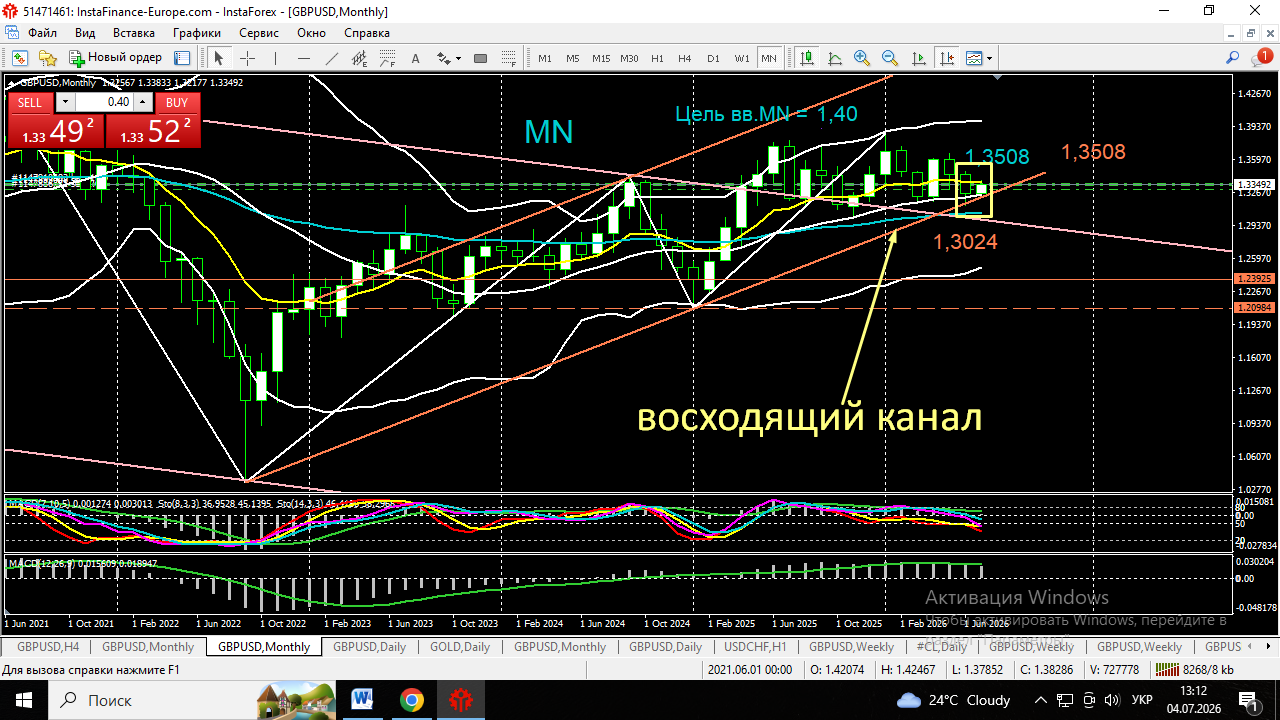

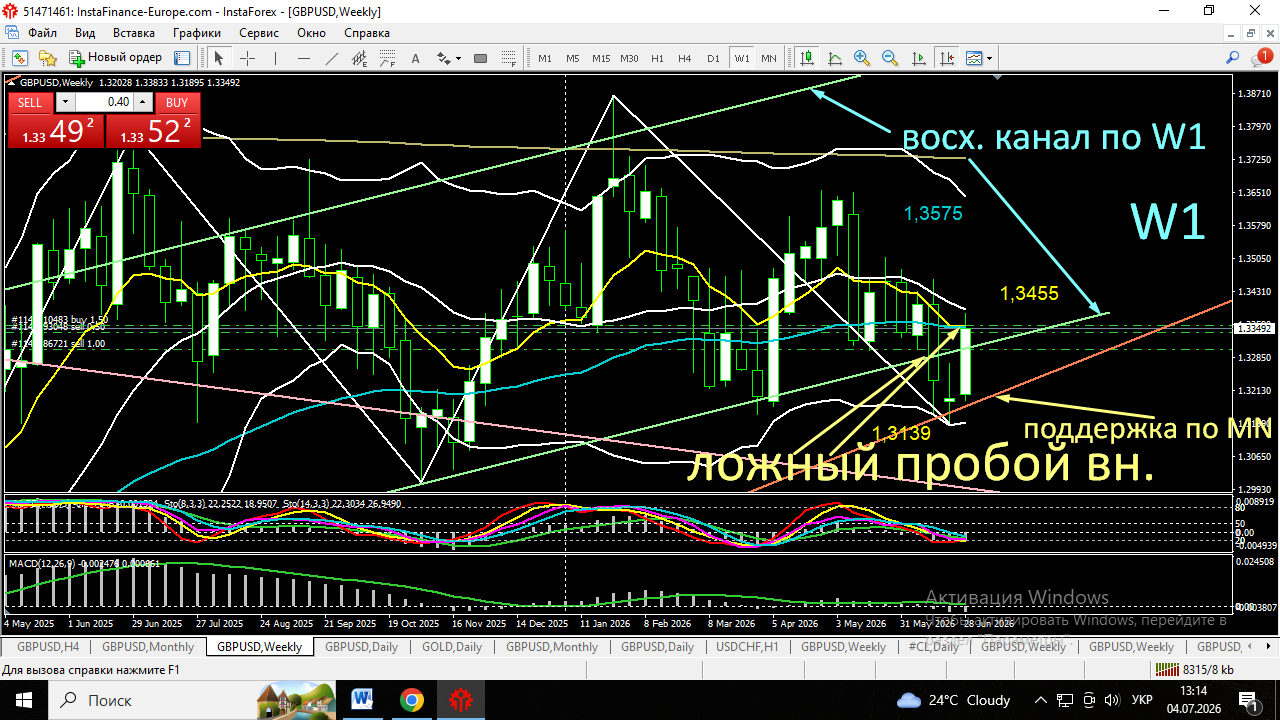
The channel system on the MN and W1 timeframes is very indicative. MN – there is an ascending channel, the price went down to the support and the June candle touched it, but closed above the support. The June candle, a doji, means uncertainty in choosing the direction. The July candle is so far bouncing up from the support, but the candle is still active and it’s a long way until the close. W1 – Here there is also an ascending channel, in green, and the projection of the monthly channel support, in red. However, the situation on this channel is expressed more clearly. 1. False breakout down through the support of the weekly ascending channel. 2. Touch of the monthly channel support, 3. bounce up from it and 4. return into the weekly timeframe channel, 5. weekly candle close above the weekly channel support. In addition, 6. the last weekly candle failed to update the previous low, which gave a signal of a halt in the downward move on the W1 timeframe. Also, 7. at the low there is a reversal candlestick pattern. And 8. the price, MA10 and MA50 converged at the same point = 1.3350.
*The market analysis posted here is meant to increase your awareness, but not to give instructions to make a trade
 Italiano
  Русский
 English
 Bahasa Indonesia
 Bahasa Malay
 ไทย
ไทย Español
 Deutsch
 Български
 Français
 Tiếng Việt
 中文
中文 বাংলা
বাংলা हिन्दी
 Čeština
 Українська
 Română