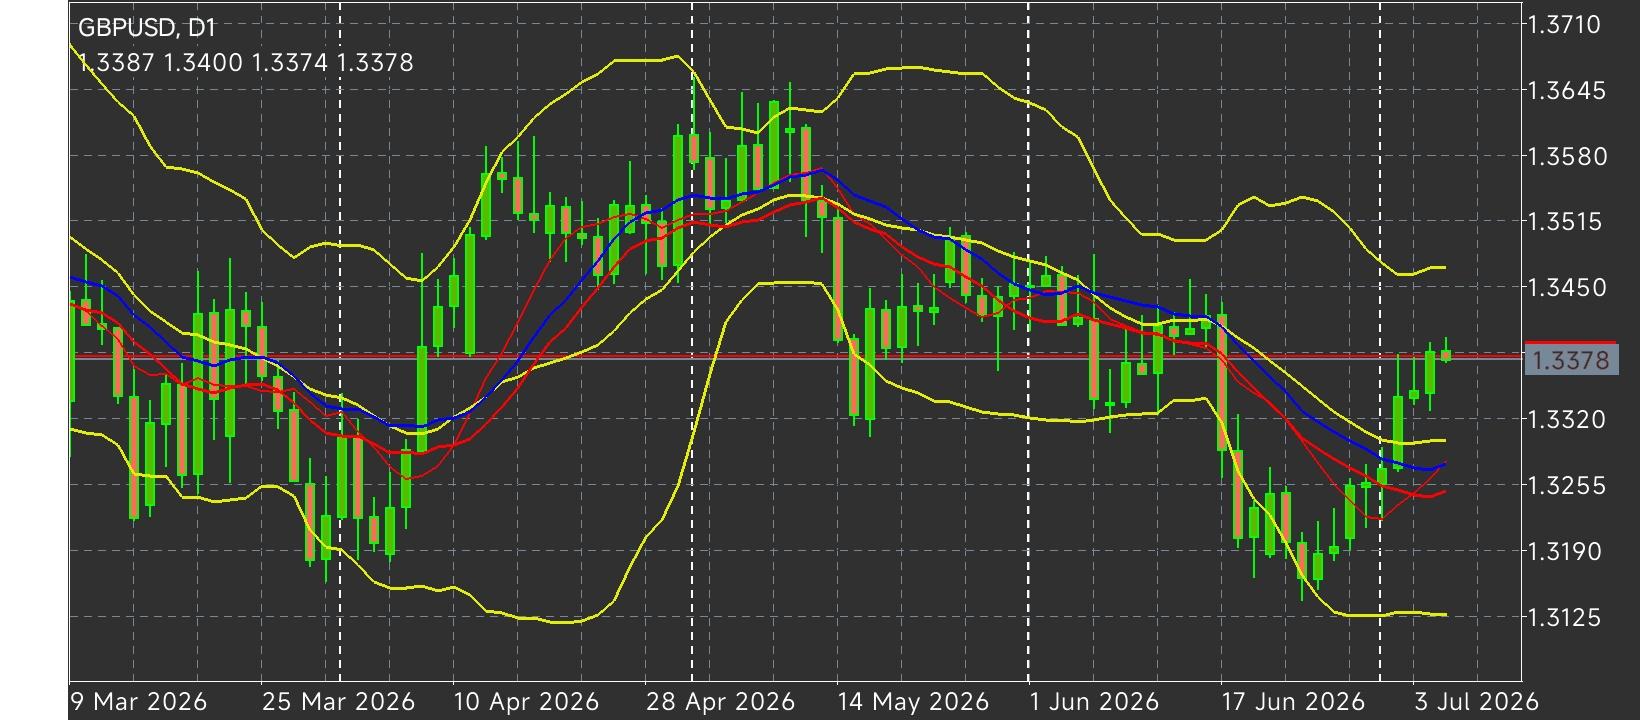
 THE BENCHMARK COIL: GBP/USD HOVERS AT 1.3380 AS GEOPOLITICAL PREMIA AND UK LEADERSHIP CORONATION CORNER THE TAPE
 The
GBP/USD currency cross (Cable) exhibited a minor intraday consolidation bias during Tuesday’s European session, drifting slightly lower to touch the
1.3380 baseline. Despite this brief pause, the pairs' underlying tape displays a resilient structural configuration. The US Dollar Index ($DXY$) caught a mild 0.1% safe-haven tailwind to hover near
100.90 as global macro desks price in a persistent geopolitical risk premium stemming from Iran's aggressive tariff mandates over the critical Strait of Hormuz chokepoint. However, the Greenback’s advance remains capped by widespread caution ahead of Wednesday's critical FOMC minutes from the June policy meeting. Concurrently, the British Pound continues to find insulation in solid domestic support following the dramatic political transition in Westminster. Following Prime Minister Keir Starmer’s recent resignation, newly elected Makerfield MP and Mayor of Greater Manchester, Andy Burnham, has emerged as the definitive frontrunner for the premiership. Burnham’s proactive policy commitments to strictly honor existing fiscal frameworks and borrowing rules have reassured institutional sovereign debt desks, helping offset downbeat domestic service sector PMIs and keeping Cable buyers securely positioned on any minor pullbacks.
GBP/USD TECHNICAL TREND STRUCTURE: STALWART RECOVERY COMPLEX From a specialized technical overview, GBP/USD is executing a constructive counter-trend recovery from its multi-week liquidity base. The active spot exchange rate continues to trade cleanly above short-term moving averages, validating an active near-term buyer advantage.
1. Overhead Trend Barriers and Technical Breakout Horizons: The underlying trend architecture indicates that while the short-term bias favors the buy-side, a series of historical structural blocks guard the primary macro pipeline:
The 1.3526 Trendline Barrier: Immediate structural resistance is defined by a heavy, downward-sloping trendline currently calculating around
1.3526. A clean, high-volume daily close above this line is required to invalidate the mid-quarter bear structure and unlock a direct run toward the
1.3645 cyclical peak.
The 1.3450 Distribution Ceiling: Prior to testing the primary trendline, intermediate upward extensions will face an institutional supply cluster at the
1.3450 horizontal shelf, where heavy sell-side order books are expected to defend the medium-term bear regime.
2. Downside Support Thresholds and Invalidation Triggers: The 20-Day EMA Defensive Cushion: On the downside, the
20-day Exponential Moving Average (EMA) at 1.3320 functions as the immediate dynamic line in the sand. With the 14-day Relative Strength Index (RSI) tracking comfortably at 55.7, the momentum remains positive; hence, the 20-day EMA must hold to sustain the active bull profile.
The 1.3140 Cyclical Floor: The ultimate anchor for the entire recovery sequence resides at the late-June low of
1.3140. A decisive daily close below this deep support level would completely shatter the active higher-low sequence, triggering systematic trend-following algorithms to accelerate markdown extension targets toward the sub-1.3000 psychological handle.
*The market analysis posted here is meant to increase your awareness, but not to give instructions to make a trade
 Italiano
 Русский
 English
 Bahasa Indonesia
 Bahasa Malay
 ไทย
ไทย Español
 Deutsch
 Български
 Français
 Tiếng Việt
 中文
中文 বাংলা
বাংলা हिन्दी
 Čeština
 Українська
 Română
