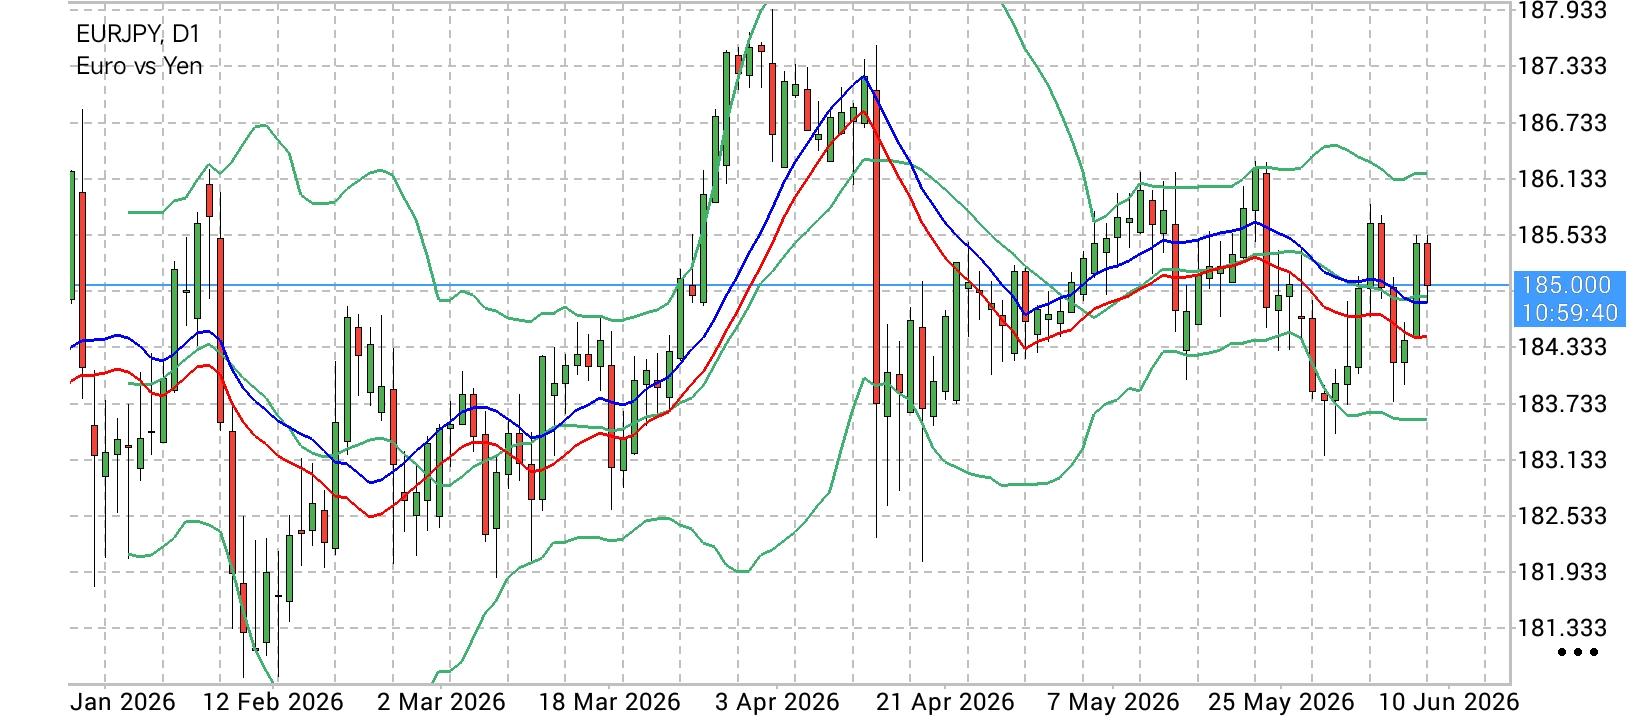
 The Convergent Coil: EUR/JPY Compresses Near 185.00 within Symmetrical Triangle as Dynamic EMAs Anchor Bullish Ambitions
 The
EUR/JPY currency cross maintained its upward trajectory for a second consecutive session on Monday, solidifying its position around the psychological
185.00 milestone during Asian trading hours. The cross retains a highly constructive near-term technical posture, insulated by an underlying matrix of short- and medium-term support layers. Market structure reveals a classic compression regime as the spot exchange rate positions itself above both the 9-period and 50-period Exponential Moving Averages (EMAs), signaling a quiet but steady accumulation of buy-side liquidity. Further reinforcing this immediate demand block is the Volume-Weighted Average Price (
VWAP) anchoring near
184.31, which serves as an institutional line in the sand for intraday buyers. Meanwhile, the 14-day Relative Strength Index (
RSI) is hovering around the
51.00 midline, reflecting balanced yet firming momentum that gives bulls ample room to engineer an upside expansion before reaching overbought thresholds. A comprehensive technical breakdown of the daily (D1) chart illustrates that EUR/JPY is coiling tightly within a textbook
Symmetrical Triangle macro-structure. This multi-week pattern highlights an intensifying battle for dominance; both buyers and sellers are aggressively compressing the price into an increasingly narrow range, establishing a temporary macroeconomic equilibrium. However, because this compression is occurring directly above major moving average clusters, the structural path of least resistance is tilting toward an upside breakout. If the Eurozone bulls can maintain their current traction, the cross is poised to test the descending upper boundary of the symmetrical triangle, located near the
185.90 supply zone. A verified daily breakout and sustained candle close above this chart boundary would signal a powerful bullish emergence, neutralizing the recent corrective cycle and exposing the historic all-time high of
187.95 registered on April 17. Conversely, the downside remains fiercely defended by layered technical filters. The immediate dynamic buffer is anchored at the 50-day EMA of
184.91, followed immediately by the trailing 9-day EMA at
184.71. Should macroeconomic catalysts trigger a broad safe-haven liquidation into the Japanese Yen, a breakdown beneath these moving averages will shift the focus to the symmetrical triangle's lower ascending boundary near
183.60. Institutional buy orders are expected to cluster heavily around this trendline floor. Only a high-volume breakdown below this structural support matrix would compromise the broader bullish narrative, opening up a swift markdown vector toward the March 16 four-month cyclical low at
181.87, with deeper capitulation targets mapped at the six-month low of
180.81.
Technical Trend Structure: Macro Compression Inside Symmetrical Triangle On the daily chart, EUR/JPY's market geometry reflects an impending volatility expansion. The pair has spent weeks digesting its April peak, compressing into a definitive terminal apex that demands a major trend-redefinition breakout.
The Symmetrical Wedge Regime: The overarching market architecture is defined by converging trendlines that represent an equalizing force between supply and demand. The structural trend remains structurally sound and favors a bullish continuation as long as the spot price sustains daily candle structures above the dynamic
184.71/184.91 EMA cushion.
Oscillator and Trend Metric Calibration: The momentum tracking setup validates the current consolidation phase. The daily RSI's position at
51.00 signifies a structural reset, clearing out the extreme premium built up during the April rally. The tight convergence of the
9-day EMA (184.71) and the
50-day EMA (184.91) further shows a market ready to snap out of its range. Because the spot rate is maintaining price acceptance above these key markers, bias is leaning long.
The Strategic Breakout Frontiers: For bulls to unlock the macro expansion cycle, they must engineer a clean daily close above the upper resistance ceiling at
185.90. Doing so confirms a structural trend breakout, paving a path toward the
186.75 intermediate extension before targeting the all-time high of
187.95. On the downside, tactical defensive layers are mapped at
184.71, with primary structural invalidation located at the triangle's ascending floor at
183.60. A decisive daily close below
183.60 would shift the structural bias from neutral-bullish to aggressively bearish, mapping a fast markdown path toward
181.87 and
180.81.
Strategic Trading Execution Grid: Position Orientation Actionable Entry Trigger Primary Target (TP) Protective Stop (SL) Technical Architecture & Rationale Trend-Breakout Long Daily Close >
186.10 187.20 / 187.90 184.95 Breakout trade executed on a verified daily candle close above the descending triangle resistance wall, targeting a retest of the all-time high.
Triangle-Floor Bounce Long Limit Order @
183.80 185.50 / 185.80 183.10 Value long positioned on a deep pullback to the ascending triangle trendline, trading the internal range boundary with an tight structural stop.
*The market analysis posted here is meant to increase your awareness, but not to give instructions to make a trade
 Italiano
 Русский
 English
 Bahasa Indonesia
 Bahasa Malay
 ไทย
ไทย Español
 Deutsch
 Български
 Français
 Tiếng Việt
 中文
中文 বাংলা
বাংলা हिन्दी
 Čeština
 Українська
 Română
