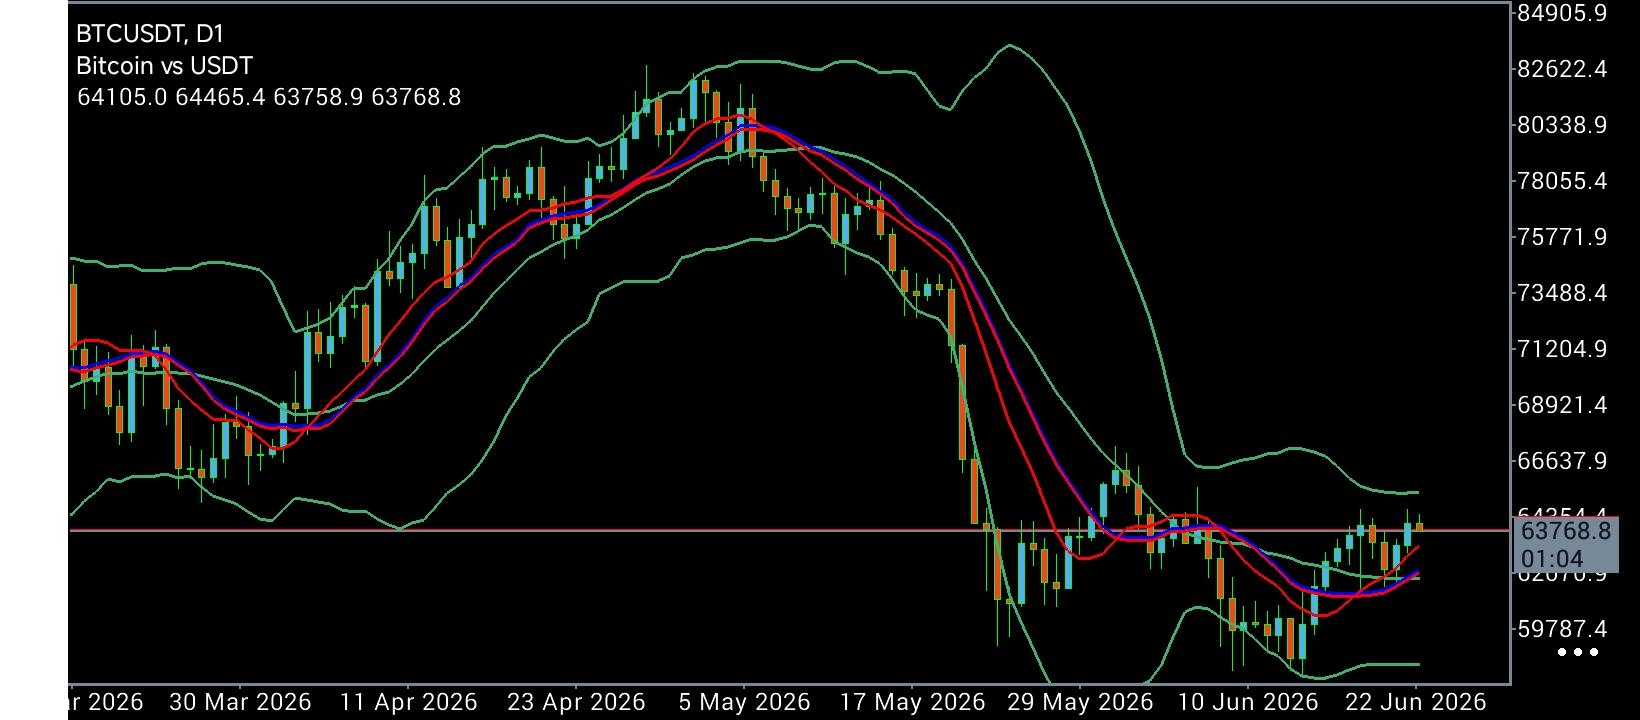
 The Volatility Bottleneck: BTC/USDT Tests Core Reversion Barrier at $63,768 as Converging Moving Averages Signal Tightening Squeeze
 The macro chart structure for
BTC/USDT on the daily time horizon spans an institutional journey from an expansive markup cycle down to an intense distribution phase, concluding with a violent capitulation flush that has given way to the current corrective bottoming pattern. Bitcoin is presently trading at
63,768.8, operating within a highly compressed session block between an intraday high of 64,465.4 and a short-term liquidity floor at 63,758.9, after opening the daily candle at 64,105.0. This dynamic structure is dictated by price action interacting with a three-layered moving average ribbon—consisting of the red short-term, blue medium-term, and cyan long-term averages—acting inside bounded green envelope bands. Having collapsed from an early-May peak near 82,622.4, the market is currently undergoing an intense cluster retest as buyers attempt to solidify a stable floor within the key
59,787.4 to 64,465.4 horizontal inflection zone.
Chronological Trend Evolution: The Four Market Chapters The historical journey of price over this multi-month duration cleanly separates into four distinct technical environments: A short-covering rally pushed the spot exchange rate back through 62,010.9, successfully reclaiming the red, blue, and cyan moving averages. While this bounce establishes a higher low and higher high structure on lower timeframes, the recovery has stalled directly underneath the 63,768.8 to 64,465.4 resistance wall—a vital support shelf from late May.
Technical Trend Geometry: The Envelope Matrix: The asset sits directly inside a technical compression zone. Although short-term momentum has tilted bullish due to the reclaim of the moving average ribbon, these lines remain relatively flat and have not yet fanned out into an active trend-supporting engine. Simultaneously, the green envelope bands have contracted dramatically following the June washout, a classic pattern that typically serves as a precursor to a high-volume breakout expansion.
Strategic Trading Execution Grid: The tactical approach below maps out actionable entry parameters based on the structural levels detailed above:
Strategic Position Actionable Entry Trigger Primary Take-Profit (TP) Protective Stop-Loss (SL) Technical Rationale & Market Mechanics Trend-Continuation Short Limit Order Entry @
$64,400.0 $62,100.0 / $59,900.0 $65,150.0 Fades the upper boundary of the active consolidation zone, trading in alignment with the dominant lower-high macro sequence with an invalidation stop above the resistance shelf.
Momentum Breakout Long Two Consecutive Daily Closes >
$64,465.4 $66,600.0 / $68,900.0 $63,400.0 Capitalizes on a short-covering squeeze triggered by a expansion beyond the envelope midline, utilizing a protective stop placed back inside the moving average node.
Mean-Reversion Long Limit Order Entry @
$62,050.0 $63,700.0 / $64,400.0 $61,200.0 Binds long entry directly to the dynamic confluence of the converging red, blue, and cyan moving averages, targeting a bounce back to the range high.
*The market analysis posted here is meant to increase your awareness, but not to give instructions to make a trade
 Italiano
 Русский
 English
 Bahasa Indonesia
 Bahasa Malay
 ไทย
ไทย Español
 Deutsch
 Български
 Français
 Tiếng Việt
 中文
中文 বাংলা
বাংলা हिन्दी
 Čeština
 Українська
 Română
