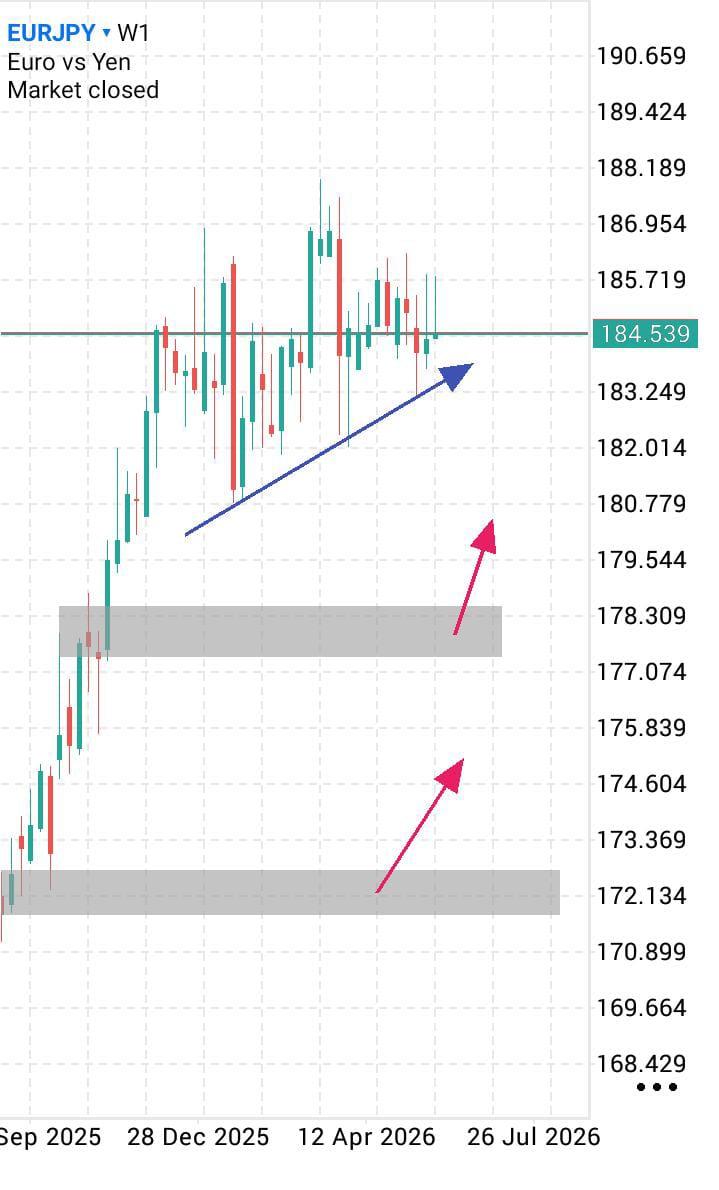
EURJPY W1 Technical Analysis :
Bullish Structure Holding Above Key Support. EURJPY on the weekly timeframe is trading around 184.539 and the overall structure remains bullish despite a consolidation phase over the last 3 months. From September 2025 to April 2026 the pair staged a strong rally from the 172.134 demand zone all the way up to the 187.954 swing high. Since that high, price has pulled back and is now trading in a range just above a rising trendline and the 184.539 horizontal level. The weekly chart is showing higher lows, which keeps the uptrend intact, but momentum has slowed as buyers and sellers battle near the top of the range. The most important support to watch is the blue rising trendline that connects the higher lows from December 2025 to June 2026. Price is currently sitting right above this trendline, and the last two weekly candles have held it as support. This trendline represents the backbone of the current uptrend. As long as EURJPY closes above it, the bias stays bullish and dips should be bought. A weekly close below the trendline would be the first technical warning that the bullish structure is weakening and could open a deeper correction toward the grey demand zones below. Speaking of demand, there are two major weekly zones marked in grey. The first and more immediate one is between 177.074 and 178.309. This area acted as resistance during the December 2025 rally and then flipped to support when price broke above it in January. The pink arrow pointing up from this zone shows that buyers would likely defend it again if price pulls back further. The second and deeper demand is between 171.134 and 172.134. This was the base of the entire move up and also aligns with the pink arrow at the bottom of the chart. For now that level is far away, but it is the line in the sand for weekly bulls. A weekly close below 171.134 would invalidate the multi-month uptrend and shift the bias to bearish. On the resistance side, 184.539 is acting as a short-term pivot. The green horizontal line has been tested 5 times since February 2026. Price has both rejected from it and consolidated around it, which shows that it is a fair value area for the market right now. Above 184.539, the next target is the recent swing high near 186.954. A weekly close above 186.954 would confirm continuation of the uptrend and likely trigger a move toward 188.189 and then 189.424. The blue arrow on the chart projects this path, showing that if buyers defend the trendline, the next leg could take price to new highs above 187.000. The current weekly candles show indecision. We have a mix of green and red candles with long wicks around 184.539, which tells us that neither side has full control. This kind of consolidation after a strong trend is normal. It allows the market to digest gains before the next move. The fact that lows are still rising along the blue trendline means sellers have not been able to break structure yet. From a bias perspective, EURJPY W1 remains bullish while it holds above the blue trendline and 184.539. For bulls, the plan is simple: hold the trendline, reclaim 185.719, and then push for a break above 186.954. That would confirm the next leg higher toward 188.189. For bears, they need a weekly close below the blue trendline followed by a break of the 177.074-178.309 demand. That would confirm a deeper correction and likely target the 172.134 zone. In summary, the weekly chart is telling us that EURJPY is in a healthy pullback within an uptrend. Supply near 186.954 has capped price for now, and demand at 184.539 and the rising trendline is holding. As long as 177.074 holds, the path of least resistance is still up. A loss of the blue trendline would be needed to suggest that the rally from 172.134 is over. Until then, expect the market to rotate between 177.074 support and 186.954 resistance, with a breakout above 186.954 favoring bulls and a break below the trendline favoring bears.
*The market analysis posted here is meant to increase your awareness, but not to give instructions to make a trade
 Italiano
 Русский
 English
 Bahasa Indonesia
 Bahasa Malay
 ไทย
ไทย Español
 Deutsch
 Български
 Français
 Tiếng Việt
 中文
中文 বাংলা
বাংলা हिन्दी
 Čeština
 Українська
 Română
