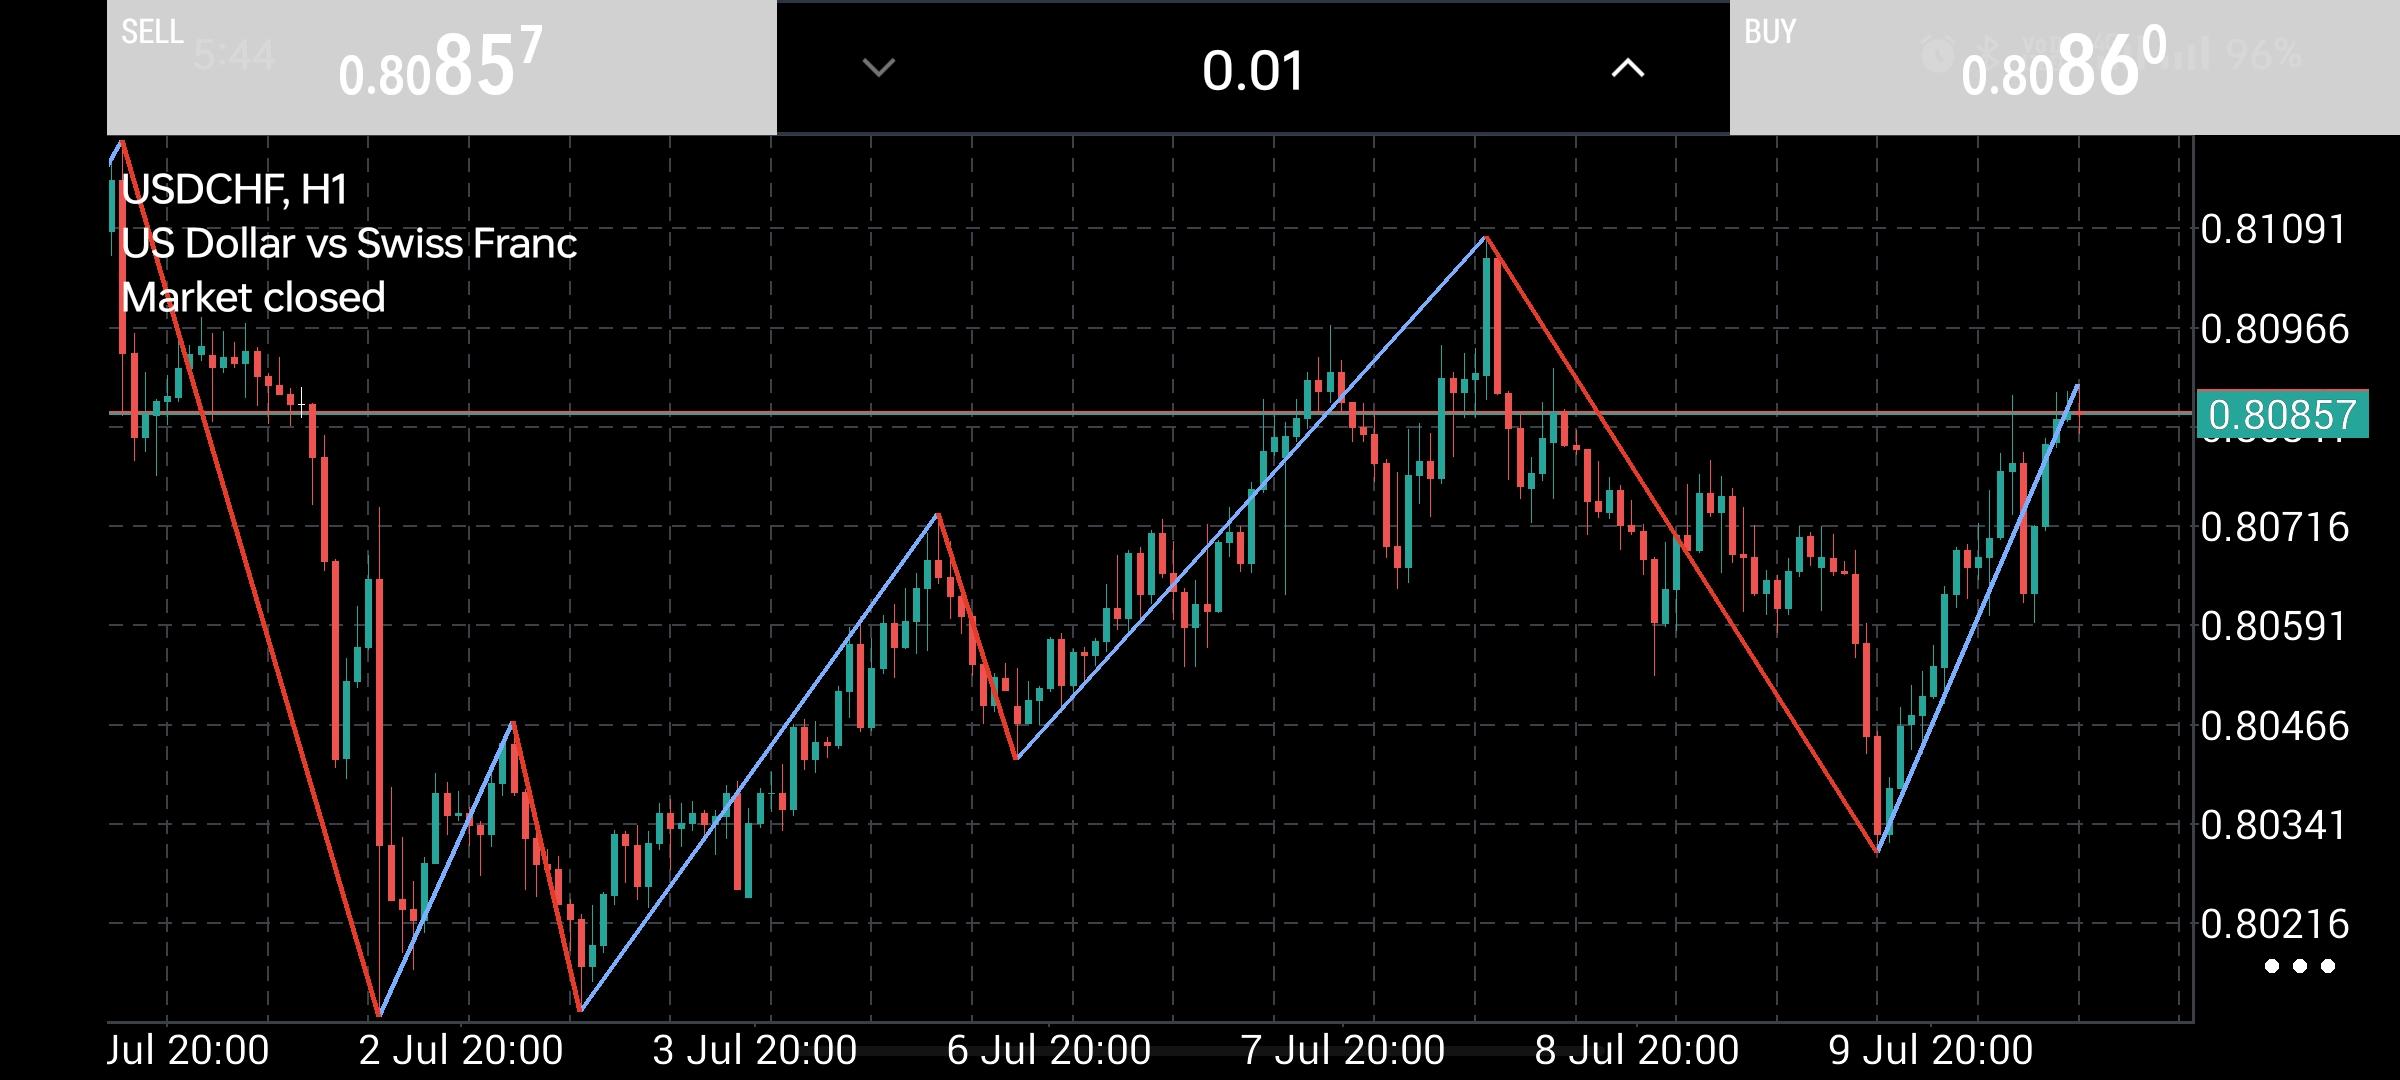
Based on the 1-hour chart for ,USD/CHF, the market is currently showing an interesting structural setup as it goes into the weekend close. Here is a technical breakdown of the price action and key levels to look out for when the market reopens: 1. Market Structure & ZigZag Pattern The blue and red overlay line likely a ZigZag indicator clearly highlights the recent swings in market structure: Double Bottom Support: Early in July, the price printed a strong double bottom near the 0.80216 level, which triggered a massive rally up to the key peak around 0.81091 on July 7th. Higher Low: After hitting that peak, the pair corrected downwards but formed a prominent higher low near 0.80341 on July 9th compared to the previous major double bottom. This structurally keeps a broader bullish reversal or recovery on the table. 2. Current Price Action The Current Price: The pair closed at 0.80857. Recent Momentum: Price action leading into the close has been strongly bullish the blue line pointing straight up from the July 9th low. The last few candles are green and pushing right against a previous minor resistance/consolidation zone. Key Levels to Watch Immediate Resistance $0.80966 - 0.81091. This is the immediate ceiling. The price is currently knocking on the door of the minor psychological resistance around 0.8090. If it breaks through, the July 7th peak at 0.81091 will be the main target for buyers. Immediate Support 0.80716. If the market opens with a minor retracement or fails to break higher immediately, look for previous minor structural shelves around 0.80716 to act as intraday support. Major Support 0.80341. This higher low is crucial. As long as the price stays above this level, the short-to-medium-term structure favors the bulls. Potential Scenarios for the Reopen Scenario A Bullish Continuation. If momentum carries over, look for a clean break above 0.80966. A sustained move above this level opens the path to retest the major swing high at 0.81091. Scenario B Pullback & Retest. Since the market closed right at a horizontal pivot zone indicated by the gray horizontal line across the chart, it wouldn't be surprising to see a slight pullback or consolidation toward 0.80716 to gather liquidity before attempting another leg up. Are you looking to trade a breakout above the recent peak, or are you waiting for a deeper pullback to enter long?
*The market analysis posted here is meant to increase your awareness, but not to give instructions to make a trade
 Italiano
 Русский
 English
 Bahasa Indonesia
 Bahasa Malay
 ไทย
ไทย Español
 Deutsch
 Български
 Français
 Tiếng Việt
 中文
中文 বাংলা
বাংলা हिन्दी
 Čeština
 Українська
 Română
