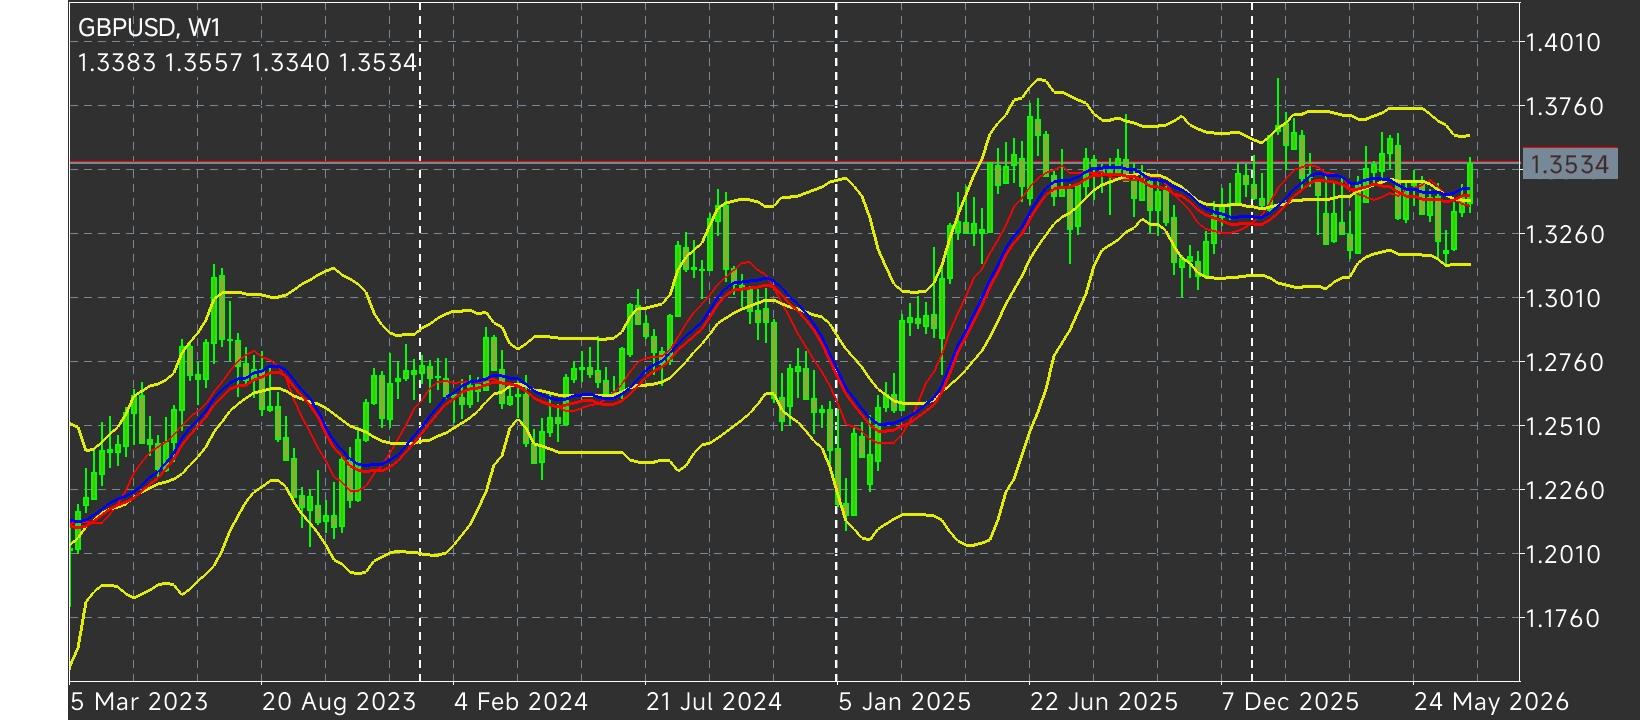
 BOE HAWKISH SHIFT BUOYS STERLING: GBP/USD HOVERS AT 1.3535 AHEAD OF DUAL ECONOMIC GAUNTLET
 The British Pound is exhibiting structural resilience against the Greenback, with the GBP/USD pair trading with minor, consolidative intraday losses around
1.3535 during Thursday's European session. Market participants are adopting a highly calculated, risk-neutral posture ahead of a crucial macroeconomic data cluster, which features the United Kingdom’s monthly Gross Domestic Product (GDP) release and the United States Retail Sales figures later in the day. The fundamental backdrop for the Sterling has shifted dramatically; a sharp escalation in Middle Eastern tensions has stoked fears of energy-driven inflation, forcing swap traders to heavily revise their monetary policy outlooks. Prior to the outbreak of the regional conflict, money markets were positioned for the Bank of England (BoE) to implement at least two interest rate cuts this year. However, soaring oil prices have fundamentally altered the inflation equation. According to recent Reuters pricing, market participants have completely priced out near-term easing, instead fully baking in a 25-basis-point rate hike by the BoE's November policy meeting, with a secondary rate hike priced in by April 2027. This aggressive hawkish repricing is providing Sterling with a robust yield-spread advantage, allowing it to easily absorb the broader, safe-haven-driven bids supporting the U.S. Dollar.
Technical Trend Structure: Daily Chart Matrix From a technical perspective, the daily (D1) chart showcases a remarkably constructive recovery. Having successfully dismantled key dynamic moving averages, GBP/USD continues to trade within a clearly defined bullish ascendancy.
1. Overhead Supply Barriers & Key Pivot Levels: The 1.3534 Bollinger Band Ceiling: The immediate hurdle is the daily upper Bollinger band located near
1.3534. The price is currently resting directly on this dynamic band, which suggests that while the near-term upswing is technically stretched, momentum is being sustained rather than exhausted.
The 1.3637 High-Volume Node: A decisive daily breakout above the upper Bollinger band exposes the critical swing high of
1.3637 (the May 8 peak). Clearing this supply pool is necessary to open the technical doors for a wider rally.
The 1.3700 Psychological Target: Should buyers successfully neutralize the sellers at the May peak, the pair is expected to accelerate toward the major psychological milestone at
1.3700, a level that represents a key long-term structural pivot.
2. Supported Demand Shelves & Liquidity Pools: The 100-Day SMA Support ($1.3400): This serves as the primary line of defense for the bulls. The pair's ability to trade comfortably above the 100-day Simple Moving Average (SMA) at
1.3400 confirms that the medium-term trend has rotated in favor of the buyers.
The Bollinger Middle Band Cushion ($1.3325): If a macro-driven pullback occurs, the 20-day Bollinger middle band at
1.3325 acts as the secondary structural safety net. Buyers are highly likely to defend this dynamic pivot to preserve the bullish structure.
The 1.3117 Volatility Floor: In the event of an aggressive risk-off selloff, the ultimate downside floor sits at the lower Bollinger band near
1.3117. A breach below this major demand shelf would invalidate the current bullish bias and signal a return to a broader bearish regime.
Momentum Oscillator Check: The Relative Strength Index (RSI-14) is currently hovering around the
65 level. This indicates strong, persistent bullish momentum. Crucially, because the index remains below the 70 line, it suggests that the pair has room for further appreciation before hitting deeply overbought territory.
*The market analysis posted here is meant to increase your awareness, but not to give instructions to make a trade
 Italiano
 Русский
 English
 Bahasa Indonesia
 Bahasa Malay
 ไทย
ไทย Español
 Deutsch
 Български
 Français
 Tiếng Việt
 中文
中文 বাংলা
বাংলা हिन्दी
 Čeština
 Українська
 Română
