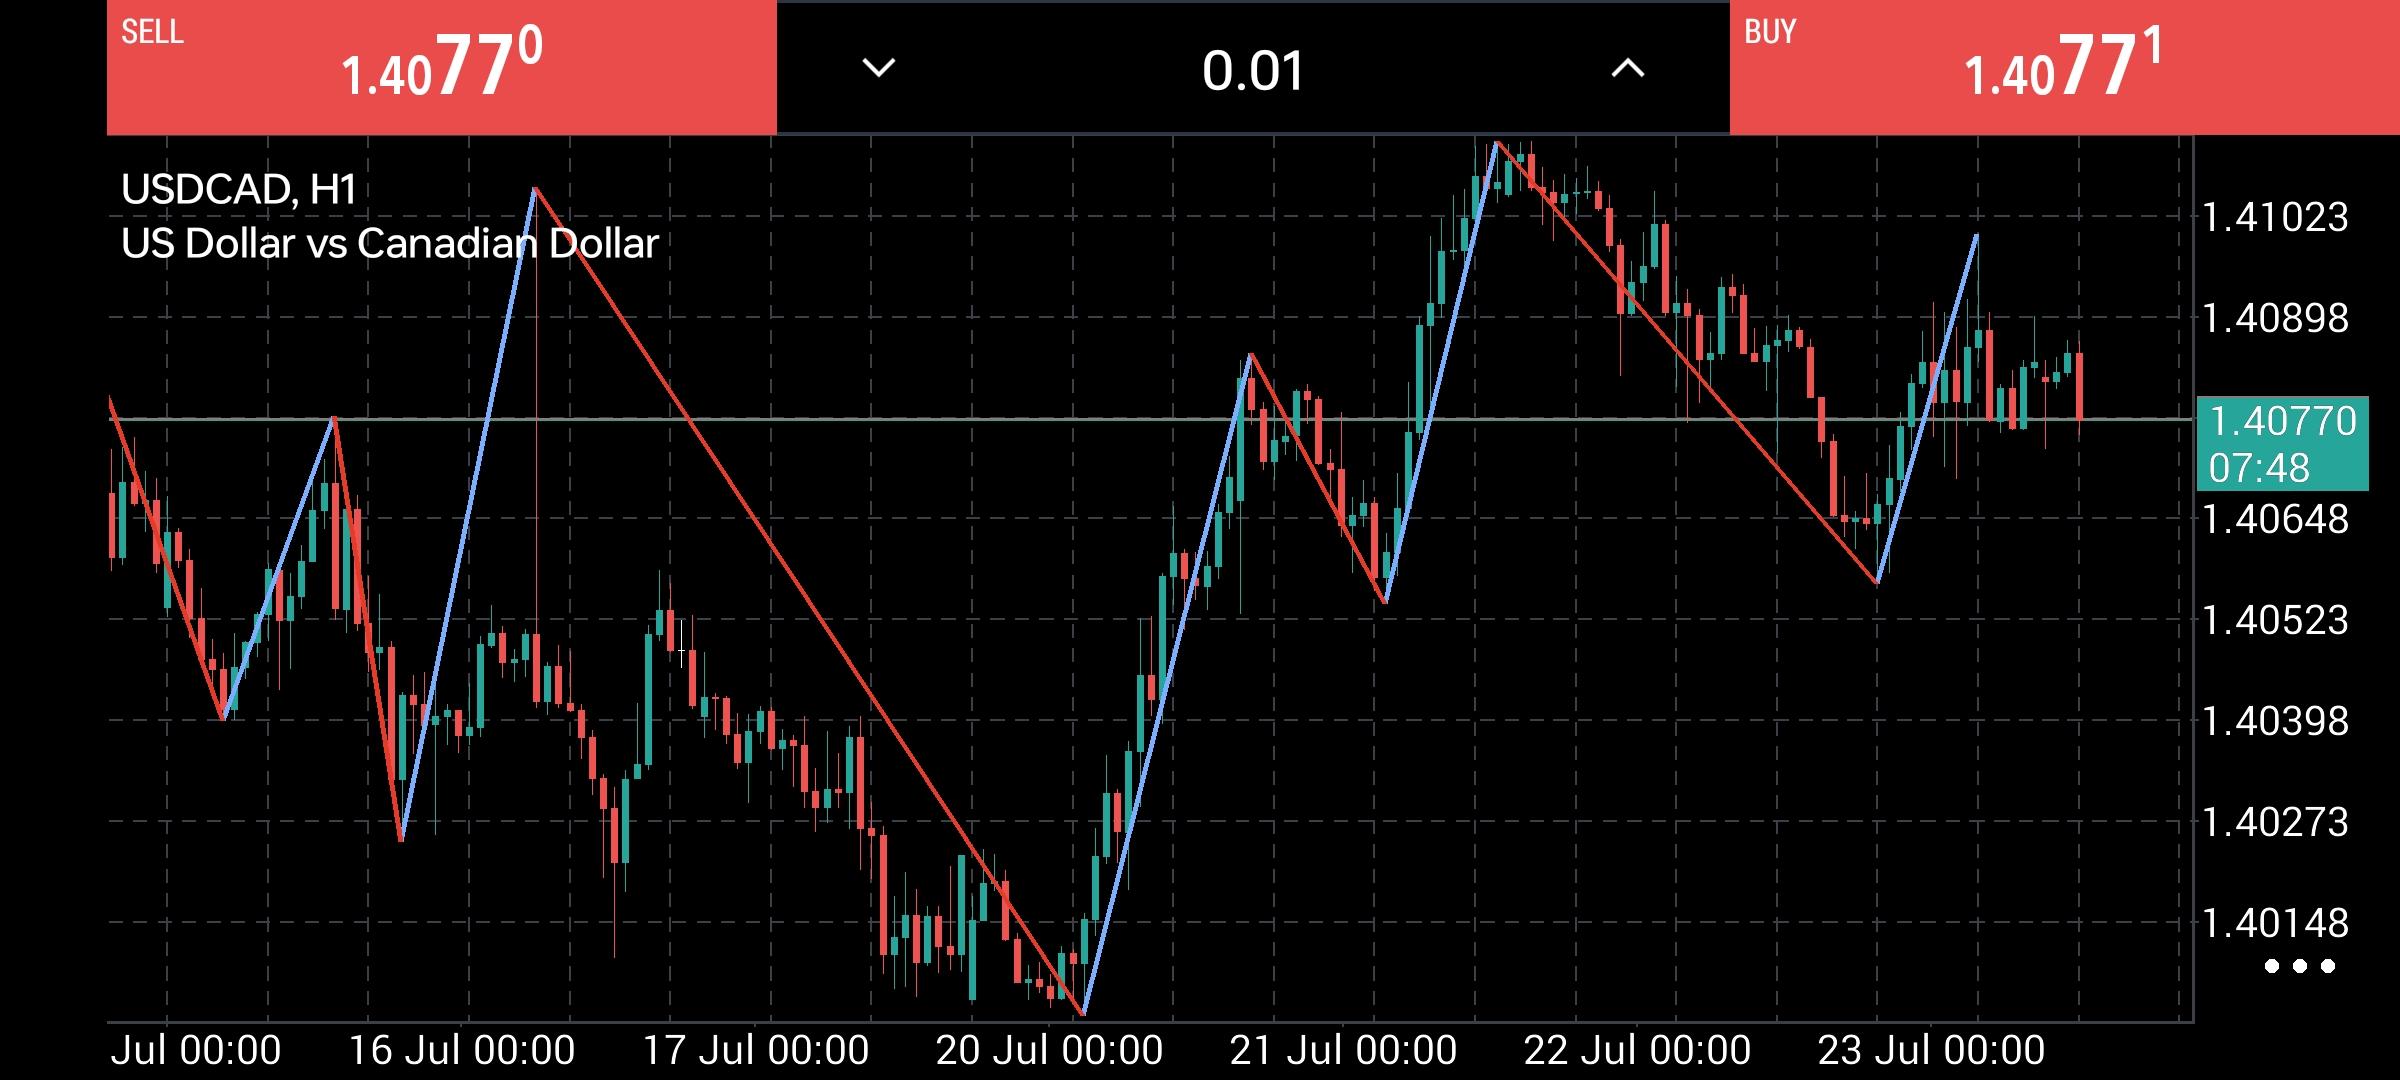
Here is a breakdown of the technical market structure and key price levels for USDCAD based on the H-1 chart: 1. Market Structure & Trend Current Trend. The H1 chart shows a recovering market structure after hitting a swing low near 1.4015 on July 20. It has formed a sequence of higher highs peaking around 1.4110 on July 21 and higher lows around 1.4055 on July 23. Current Price Action. Price is consolidating around 1.4077, trading right at a horizontal pilot zone that previously acted as both swing resistance mid-July and intermediate support. 2. Key Price Levels Level Type Price Level Significance Immediate Resistance 1.4102 , 1.4110 Highs set between July 21 and 23; clear target for buyers. Pivot Line / Current Level 1.4077 Mid-range consolidation point where the current H1 candle is hovering. Key Support 1 , 1.4055 – 1.4065 Recent higher-low swing point July 23. Major Support2, 1.4015 Main multi-day swing low July 20. 3. Potential Scenarios Bullish Continuation Trigger. A clean H1 close above the current consolidation zone ~1.4080,1.4090. Target. 1.4102 and a retest of the recent high at 1.4110. Invalidation/Stop. Below the recent swing low at 1.4055. Bearish Pullback Trigger. Failure to clear 1.4080 followed by a drop below 1.4065. Target. Retest of the major demand/support zone near 1.4055 with further downside opening up toward 1.4030 if that level breaks. Note. Pay attention to upcoming economic releases for USD or CAD, as high-impact news can quickly invalidate technical patterns on shorter timeframes like the H1. Always employ strict risk management. >
*The market analysis posted here is meant to increase your awareness, but not to give instructions to make a trade
 Italiano
 Русский
 English
 Bahasa Indonesia
 Bahasa Malay
 ไทย
ไทย Español
 Deutsch
 Български
 Français
 Tiếng Việt
 中文
中文 বাংলা
বাংলা हिन्दी
 Čeština
 Українська
 Română
