 Aussie Resilience vs. Greenback Dominance: AUD/USD Battles Trump Tariff Shock and RBA Rate Hike Expectations
 The
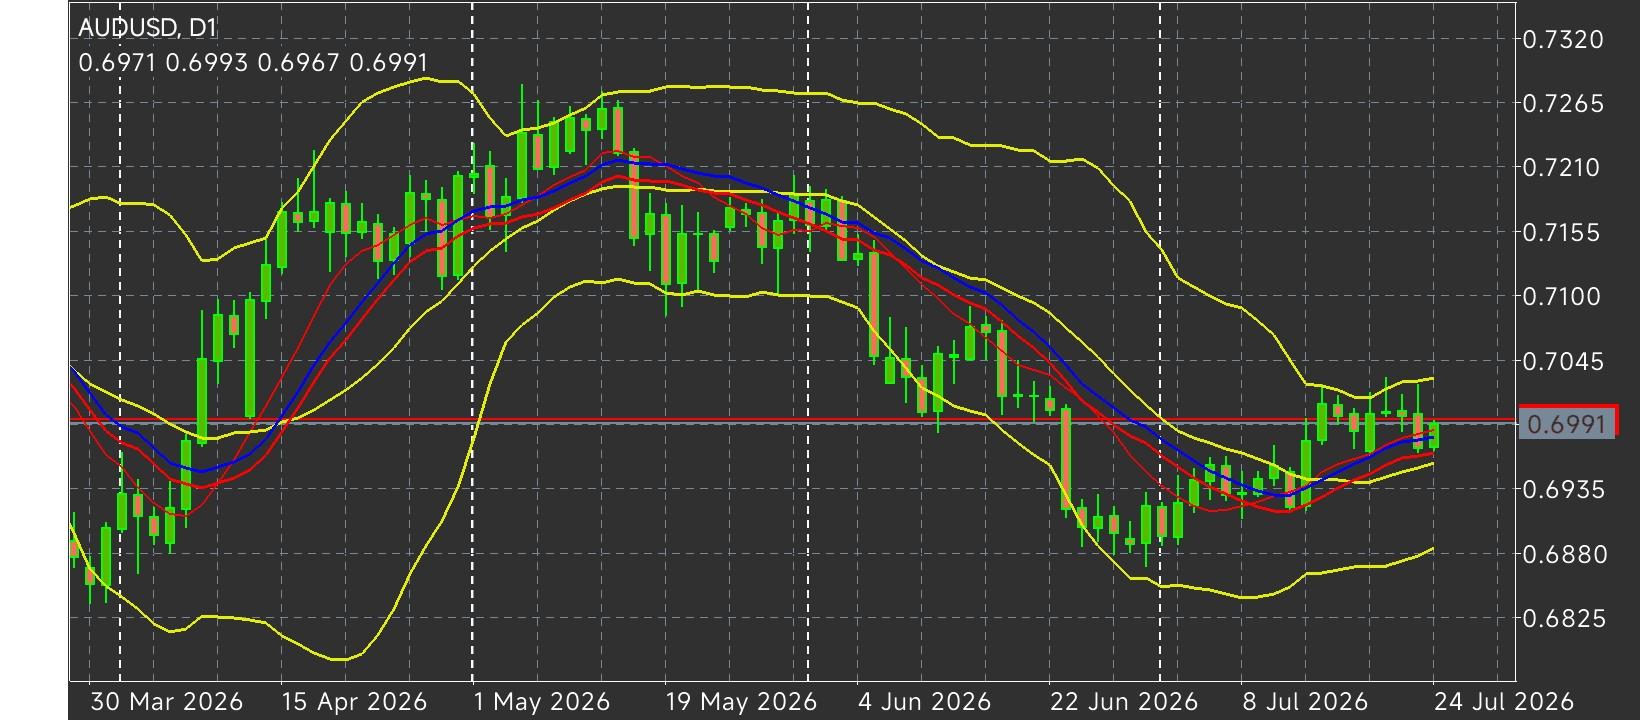
AUD/USD pair is staging a modest rebound heading into Friday's European session, clawing back a portion of the previous day's losses after dropping toward a weekly low. However, this recovery remains on fragile footing as a complex clash of macroeconomic fundamentals unfolds. While the pair recently pulled back from its five-week high near
0.7025, the underlying trend is locked in a fierce tug-of-war. On one side, the U.S. Dollar (USD) is riding a powerful weekly rally to its highest level since late June, propelled by escalating U.S.-Iran tensions, rising oil prices, and a major trade policy announcement from the White House. On the other side, surprising domestic economic resilience in Australia is keeping Reserve Bank of Australia (RBA) rate hike expectations firmly alive, providing a sturdy safety net under the Aussie dollar.
Macro Divergence: Tariff Fires and RBA Hawkishness The fundamental backdrop for AUD/USD is being shaped by two competing engines of volatility:
Trump's Tariff Blitz & Geopolitical Havens: The Greenback’s surge is heavily backed by safe-haven demand following the announcement from U.S. Trade Representative Jamieson Greer’s office regarding President Donald Trump's new tariff regimen. The administration plans to slap sweeping
10% to 12.5% tariffs on goods from 60 major trade partners, effectively covering the bulk of U.S. imports. Simultaneously, the continued military friction between the U.S. and Iran has pushed crude oil to new July highs. This double shock of trade protectionism and energy-driven inflation has forced traders to price in a higher probability of Federal Reserve rate hikes, dampening overall risk appetite.
Australia's Economic Engine Fires Up: Offsetting the foreign exchange headwinds, the Australian Dollar is drawing significant strength from solid domestic fundamentals. Flash PMI surveys confirmed a second straight month of expansion across Australia's private sector. Coming right on the heels of Thursday's upbeat employment report, these figures reinforce the market view that the RBA may be forced to raise its cash rate again. This monetary policy divergence between a hawkish RBA and a trade-war-shocked Fed is preventing a larger sell-off in the pair. Market participants now await preliminary U.S. PMI numbers and fresh geopolitical developments ahead of next week's crucial two-day
FOMC monetary policy meeting.
Technical Trend Architecture: The SMA/EMA Battle Zone From a technical perspective, the daily chart depicts an asset grappling with strong moving average confluence following its retreat from the
0.7025 resistance zone.
Dynamic Floor (20-Day SMA): Spot price found explicit buying interest near its
20-day Simple Moving Average (SMA), which continues to act as an essential short-term buffer against deeper losses.
Overhead Resistance Cluster: Recovery attempts are currently capped by the convergence of the
9-day and 14-day Exponential Moving Averages (EMAs). To re-establish a clear bullish trajectory, buyers must orchestrate a clean break above both the
50-day and 100-day SMAs.
Oscillator Momentum: Daily momentum indicators remain tilted into negative territory, indicating that short-term bears still retain a slight edge. Until the pair clears its moving average hurdles above, intraday bounces risk being sold into.
*The market analysis posted here is meant to increase your awareness, but not to give instructions to make a trade
 Italiano
 Русский
 English
 Bahasa Indonesia
 Bahasa Malay
 ไทย
ไทย Español
 Deutsch
 Български
 Français
 Tiếng Việt
 中文
中文 বাংলা
বাংলা हिन्दी
 Čeština
 Українська
 Română
