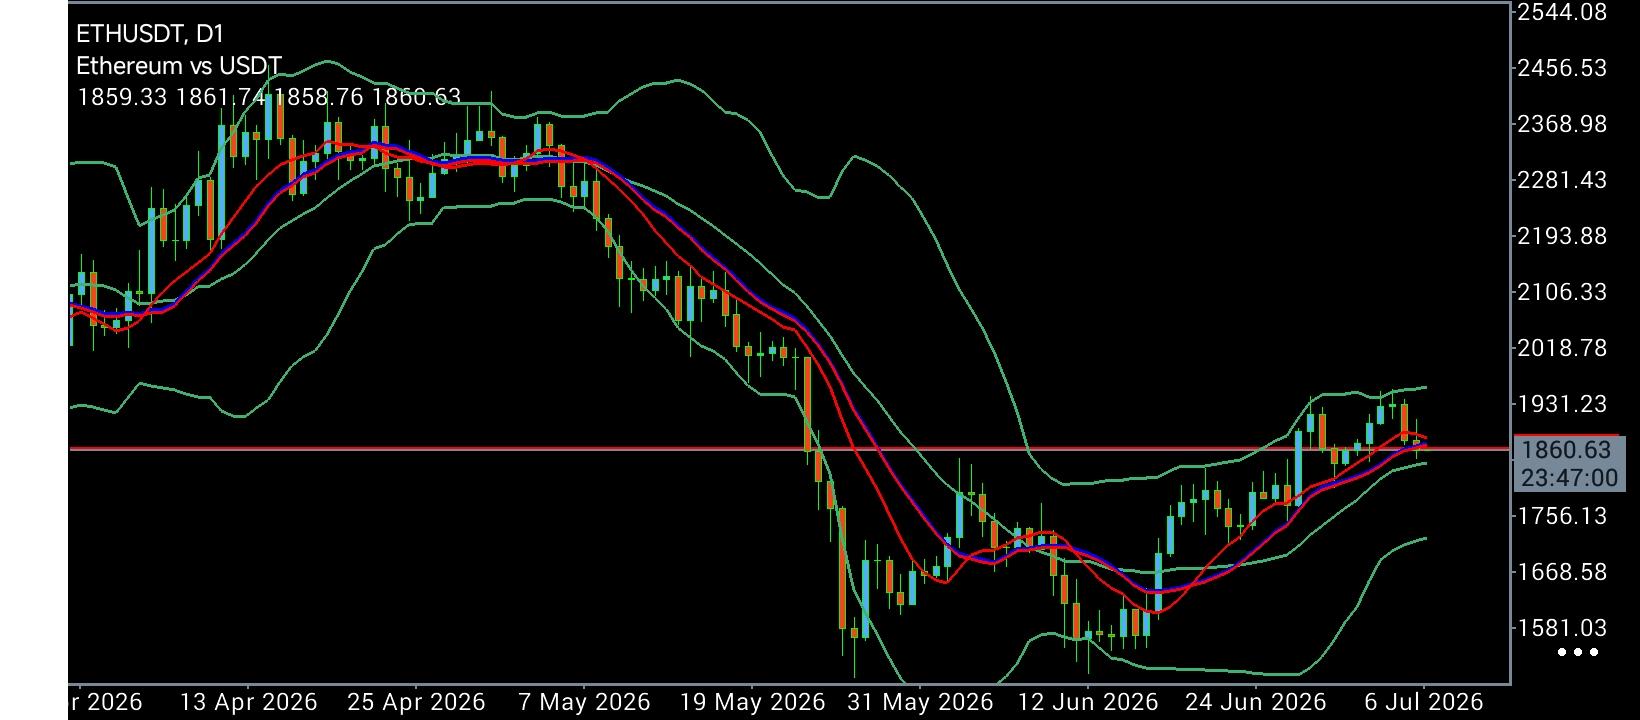
 The "Bollinger Coil": ETH/USDT Battles the 1,860.63 Pivot as Volatility Compression Teases an Impulsive Mid-Summer Breakout
 The
ETH/USDT daily architecture has entered a state of "Tight Coiling and Volatility Contraction" as of early July 2026, with the latest candle opening at
1,859.33, setting a tight range between a low of
1,858.76 and a high of
1,861.74, before stabilizing near
1,860.63. Over the three-month period from April to July 2026, the macro structure unfolded in three distinct technical regimes: an April distribution top near
2,456.53, a severe May–June bearish impulse toward the
1,581.03 capitulation low, and a steady late-June recovery that is now testing the dynamic equilibrium of the middle Bollinger Band. Following the exhaustive slide that sliced through former horizontal strongholds at
1,931.23,
1,756.13, and
1,668.58, buyers staged a structural stand at
1,581.03. This higher-low base triggered a bullish mean-reversion move, pushing Ethereum back above its short-term exponential moving averages (EMAs) and contracting the Bollinger Bands after the violent early-summer expansion. However, after tagging overhead supply at
1,931.23, price action has entered a narrow balance zone, with the moving averages flattening into a bullish alignment that lacks explosive fan-out momentum. The current structural standoff around
1,860.63 serves as the pivotal line in the sand for both market camps. A decisive multi-day close above
1,931.23—aligning with the middle Bollinger Band and the late-May breakdown origin—would officially validate the bottoming pattern from
1,581.03, shifting focus back toward the cascade of lower highs at
2,018.78,
2,106.33, and
2,193.88. Conversely, a rejection at current levels and a breakdown below immediate dynamic support at
1,756.13 would invalidate the corrective bounce, exposing secondary safety nets at
1,668.58 and risking a retest of the
1,581.03 macro floor.
Technical Trend Structure: The 1,860.63 "Squeeze Zone" and the 1,931.23 "Supply Wall" The macro geometry reflects a classic volatility compression pattern within a larger corrective uptrend.
The 1,860.63 Consolidation Node: Price is holding directly on this horizontal flip level, sandwiched between the converged red and blue short-term EMAs below and the middle Bollinger Band above.
The 1,931.23 "Breakout Gateway": The primary overhead objective for bulls remains
1,931.23. A high-volume daily close above this node neutralizes the dominant multi-month downtrend and exposes the
2,018.78 accumulation base from mid-May.
The 1,756.13 "Dynamic Sentinel": To the downside,
1,756.13 represents the critical moving-average confluence zone; losing this level on a daily closing basis shifts the near-term bias back to the bears.
Strategic Trading Matrix: Decision Nodes for the Volatility Expansion: Signal Type Entry Trigger Primary Target (TP) Protective Stop (SL) Tactical Rationale Bullish Expansion Daily Close >
1,931.23 2,018.78 / 2,106.33 1,850.00 Momentum play on Bollinger Band squeeze expansion and EMA fan-out.
Bearish Breakdown Daily Close <
1,756.13 1,668.58 / 1,581.03 1,865.00 Trend-continuation play fading the corrective bounce back toward the June low.
Key Technical Milestones: Immediate Resistance: 1,861.74 (Current candle high) followed by
1,931.23 (Swing high & Middle Bollinger Band).
Critical Support Base: 1,756.13 (EMA confluence zone) and
1,581.03 (June capitulation floor).
*The market analysis posted here is meant to increase your awareness, but not to give instructions to make a trade
 Italiano
 Русский
 English
 Bahasa Indonesia
 Bahasa Malay
 ไทย
ไทย Español
 Deutsch
 Български
 Français
 Tiếng Việt
 中文
中文 বাংলা
বাংলা हिन्दी
 Čeština
 Українська
 Română
