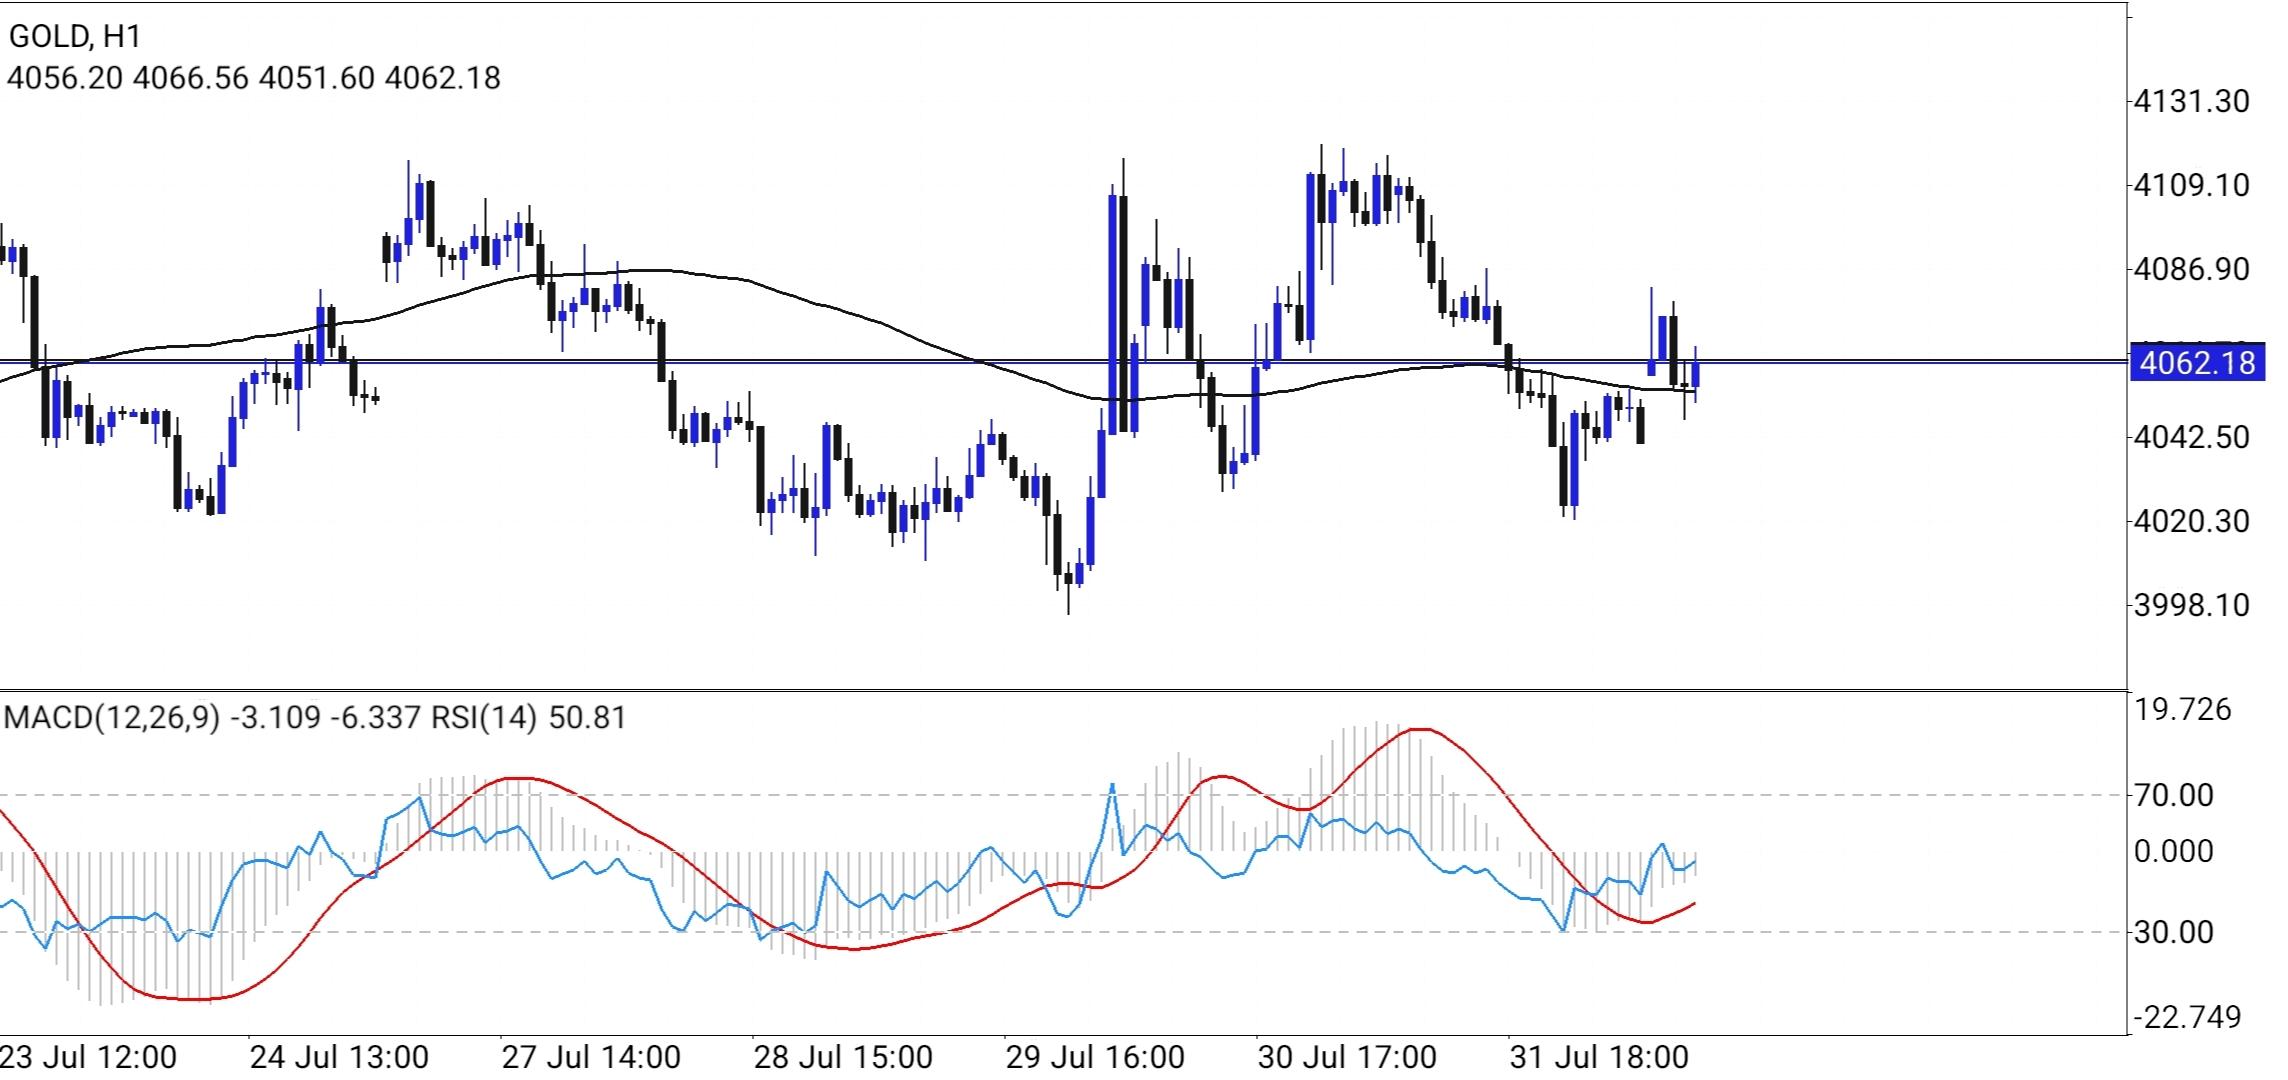
 Technical Overview of Gold (XAU/USD) on the H1 Timeframe
 The provided
Gold (XAU/USD) H1 chart reveals a fascinating range-bound and rotational market environment. Price action is currently hovering around the
4062.18 handle, showing signs of consolidation after recent liquidity expansions and contractions. Analyzing this hourly chart requires a breakdown of market structure, trend indicators, momentum oscillators, and key horizontal levels.
Price Action and Market Structure Over the displayed sessions spanning from late July to early August, Gold has exhibited high volatility marked by sharp impulsive runs followed by swift retracements.
The Recent Swings: The price experienced a sharp breakdown toward the 3998.10 region, followed by a aggressive recovery that tested highs near the 4109.10 to 4131.30 zone.
Current Consolidation: Following the rejection from upper extremes, the price has compressed tightly around the middle equilibrium line near
4062.18. This level is acting as a short-term magnet, with multiple hourly candles closing directly on or very close to this threshold.
Trend Context: The moving average plotted on the H1 timeframe is moving relatively flat, confirming a lack of a clear directional trend and pointing instead toward a consolidation phase or a balanced market range.
Indicator Analysis: Moving Average, MACD, and RSI Technical indicators on this H1 chart provide additional context regarding momentum and trend exhaustion:
Moving Average (MA): The smoothing line oscillates closely alongside current price actions around the 4062 mark. Because the line is horizontal, it reinforces the narrative of a sideways market structure where neither buyers nor sellers hold a decisive multi-period advantage.
MACD (Moving Average Convergence Divergence): The MACD values (MACD = -3.109, signal line = -6.337) indicate muted momentum. While the histogram bars show minor fluctuations, the lack of strong expansion in either direction points to indecision among intraday market participants.
RSI (Relative Strength Index): The RSI(14) prints a value of
50.81, which sits almost precisely at the centerline. An RSI reading near 50 signifies market equilibrium, meaning momentum is neutral, leaving ample room for a breakout in either direction once volume picks up during major trading sessions like London or New York.
Key Support and Resistance Zones For intraday traders monitoring this H1 chart, critical levels must be observed to map out potential setups:
Immediate Resistance: The primary overhead barrier rests near the
4086.90 to 4109.10 zone, where prior impulsive buying met strong selling pressure. A clean breakout above this region would expose the upper limit near 4131.30.
Immediate Support: On the downside, immediate floors are located near the
4042.50 handle, followed by a deeper structural support pocket around the
4020.30 level and the recent swing low near
3998.10.
Trading Outlook and Strategy Given the neutral RSI of 50.81 and the sideways moving average configuration, chasing breakouts inside the current range carries elevated risk. Intraday traders should exercise patience and wait for price to approach the outer boundaries of the current range or look for a confirmed volume-backed break. A sustained acceptance above 4086 could invite bullish continuation plays, whereas a failure to hold the 4040 support area would likely shift focus back toward the lower 4000 psychological handle. Proper risk management and monitoring lower timeframes (such as the 15-minute chart) for entry triggers remain essential.
*The market analysis posted here is meant to increase your awareness, but not to give instructions to make a trade
 Italiano
 Русский
 English
 Bahasa Indonesia
 Bahasa Malay
 ไทย
ไทย Español
 Deutsch
 Български
 Français
 Tiếng Việt
 中文
中文 বাংলা
বাংলা हिन्दी
 Čeština
 Українська
 Română
