 The Geopolitical Risk De-escalation: WTI Crude Slides Toward $73.51 Floor Amid Hormuz Transit Framework Negotiations
 West Texas Intermediate (
WTI) Crude Oil futures traded approximately 0.45% lower near the
$74.00 handle during Thursday's European session, maintaining downside momentum near the three-week low of $73.51 registered in the previous session. Energy markets are enduring consistent selling pressure as expectations mount regarding a potential reopening of the
Strait of Hormuz—the vital maritime choke point that facilitates nearly 20% of global petroleum transit. Downside repricing accelerated following statements from Iranian Foreign Ministry spokesman Esmaeil Baghaei, who confirmed that Tehran and Muscat are finalizing a proposed framework and shipping coordinates to restore commercial navigation through the waterway. Regional Gulf officials place the probability of a formal Iran-Oman accord by Friday at nearly 50%, raising prospects for an unwinding of systemic energy risk premiums. Despite forward momentum in regional negotiations, significant geopolitical friction remains. While Tehran seeks to institute a joint tolling mechanism across maritime lanes, global powers led by the United States have condemned unilateral enforcement over international transit corridors. The evolving bilateral Iran-Oman draft stands in contrast to claims posted on Truth Social by President Donald Trump over the weekend, where he asserted that Iran had agreed to an "Immediate, Complete, and Total opening of the Hormuz Strait". Given Washington's insistence on absolute freedom of navigation without unilateral taxation, market participants remain cautious regarding whether a localized transit agreement can secure broader international compliance without triggering further diplomatic pushback.
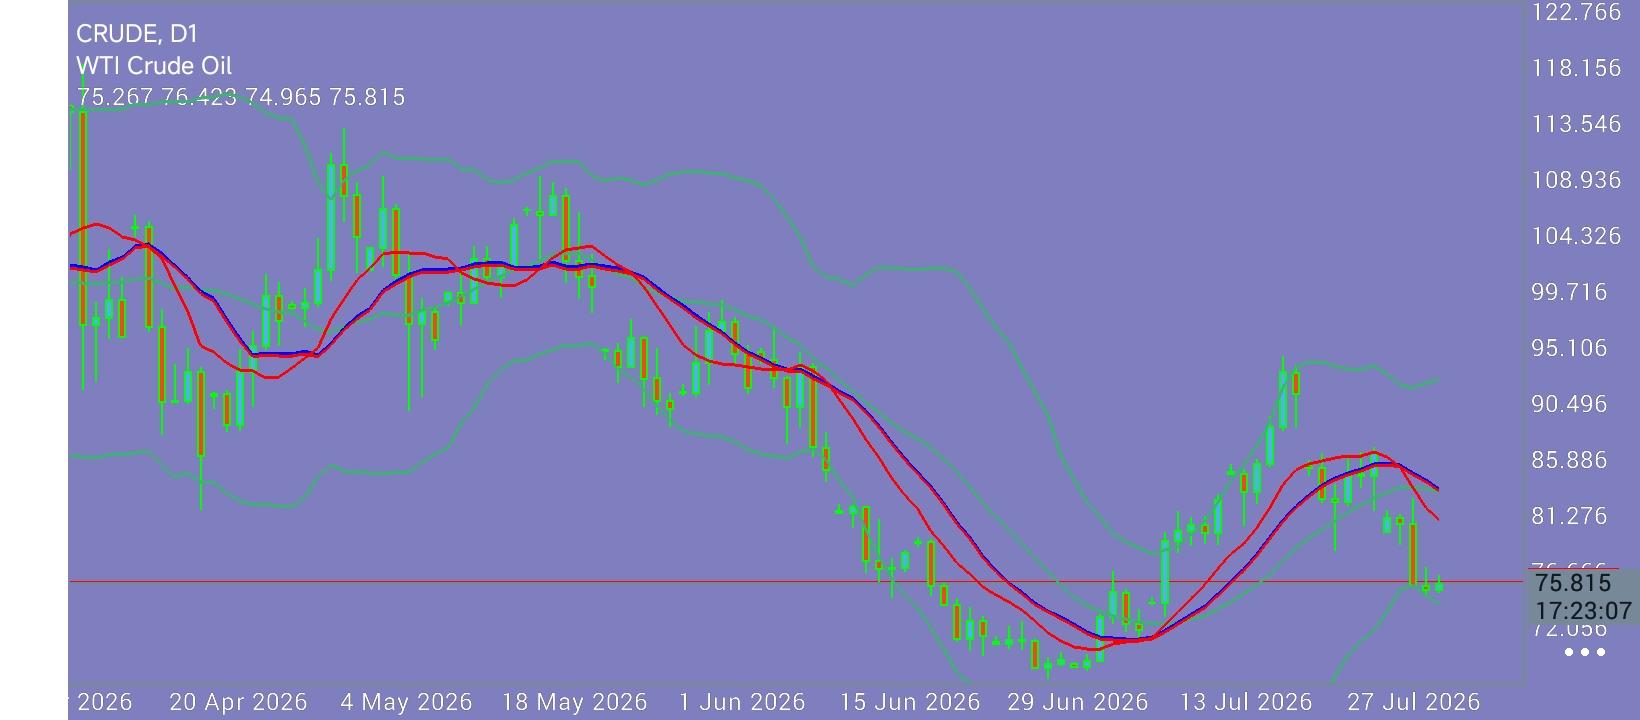
Technical Trend Structure: Dynamic EMA Ceilings & Multi-Month Support Floors On the daily chart,
WTI Crude Oil maintains a clean bearish short-term trend structure, trading firmly below key exponential trend gauges.
Primary Overhead Resistance (20-day EMA): Situated at
$79.24, functioning as the primary dynamic ceiling. Any relief rallies beneath this level are treated as corrective pullbacks within a broader downtrend phase.
Intermediate Dynamic Ceilings: The 50-day and 200-day moving averages hover higher near
$82.50 and
$85.10, cementing an overarching bearish alignment.
Immediate Support Floor ($73.51): The three-week swing low recorded on Wednesday. A daily break beneath this zone clears immediate liquidity.
Psychological Extension Target ($70.00): The primary downside objective for trend-following sellers upon a clean breakdown of current support levels.
Five-Month Structural Floor ($67.09): The major multi-month low guarding against a deeper structural collapse.
Momentum Oscillator (RSI-14): The Relative Strength Index hovers around
42, reflecting persistent seller dominance without signaling extreme oversold conditions.
Strategic Trading Decision Matrix: Setup Type Entry Trigger Primary Target (TP) Protective Stop (SL) Tactical Rationale Bearish Breakdown Short Daily Close below
$73.51 $70.00 / $67.09 $75.80 Trend-continuation trade exploiting the unwinding of geopolitical risk premiums following Hormuz headlines.
EMA Dynamic Fade Short Rejection at
$78.50 – $79.24 (20-EMA)
$74.00 / $70.00 $80.50 Tactical entry shorting corrective rallies into 20-day EMA dynamic resistance.
Bullish Reversal Long Confirmed Daily Close above
$79.24 $82.50 / $85.00 $77.10 Structural shift trade triggered only if the 20-day EMA ceiling is reclaimed with strong volume.
*The market analysis posted here is meant to increase your awareness, but not to give instructions to make a trade
 Italiano
 Русский
 English
 Bahasa Indonesia
 Bahasa Malay
 ไทย
ไทย Español
 Deutsch
 Български
 Français
 Tiếng Việt
 中文
中文 বাংলা
বাংলা हिन्दी
 Čeština
 Українська
 Română
