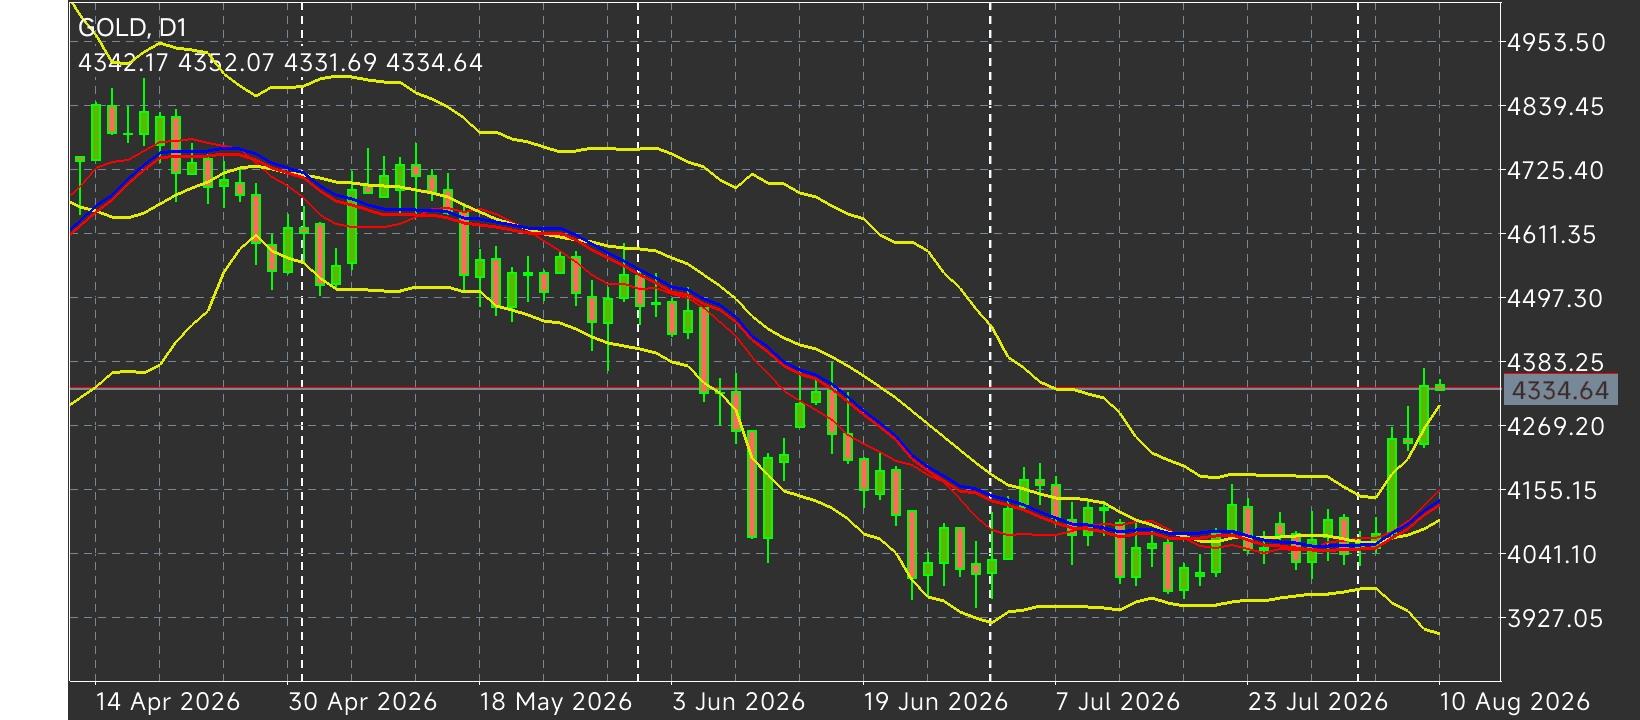
 Gold Breakout Initiated: XAU/USD Reclaims Dynamic Moving Averages as Multi-Month Base Triggers Expansion Toward $4,497 Gold (XAU/USD)
 concluded its daily session on the D1 timeframe at
$4,334.64, navigating an intraday range between an open of
$4,342.17, a high of
$4,352.07, and a low of
$4,331.69. This price action confirms a pivotal structural shift across a four-month cycle, transitioning spot bullion from a severe downward impulse into an accumulation-led reversal. Having established a durable base above its mid-year capitulation low, Gold has reclaimed key dynamic moving averages (short-to-medium-term overlays) and is expanding along the upper boundary of the yellow Bollinger Band envelope. Driven by US Dollar softening and growing market expectations of dovish Federal Reserve policy, institutional buyers have forced a clean support-resistance flip at former breakdown levels.
Phase Structural Breakdown: Distribution, Base-Building, and Trend Shift The four-month daily structural cycle decomposes into three distinct technical phases:
Phase 1: Mid-April to June Breakdown & Capitulation: Gold distributed between
$4,839.45 and
$4,611.35 in late April, printing sequential lower highs at
$4,725.40 and
$4,611.35. A decisive breakdown beneath the major Q1 pivot at
$4,497.30 in early May triggered an aggressive five-wave impulse. The decline accelerated through
$4,383.25, pushing price action against the lower outer Bollinger Band until reaching a capitulation floor near
$3,927.05 on June 26.
Phase 2: Late-June to July Base Accumulation: Following the June bottom, Gold entered a volatility contraction phase characterized by higher structural lows (
$3,927.05,
$4,041.10,
$4,155.15, and
$4,269.20). During this consolidation, moving averages flattened and curled upward. Repeated rejections near the
$4,269.20 horizontal resistance in mid-July signaled active supply absorption, compressing Bollinger Bands into a classic squeeze setup prior to expansion.
Phase 3: August Impulsive Breakout Phase: Commencing in late July and extending through August 10, buyers executed a decisive breakout candle. Pushing from
$4,155.15 through
$4,269.20 and closing at
$4,334.64, Gold closed above its short and medium-term moving average ribbon for the first time since May 8. This wide-ranging candle on August 4 confirmed institutional momentum, converting former supply levels into active demand zones.
Technical Trend Architecture & Strategic Pivot Boundaries Key Technical Boundaries: Resistance Hierarchy: R1: $4,352.07 (Session High) |
R2: $4,383.25 (Upper Bollinger Band & May Breakdown) |
R3: $4,497.30 (Major Macro Supply Zone / 61.8% Fib Extension) |
R4: $4,611.35 / $4,725.40
Current Pivot Baseline: $4,334.64
Support Hierarchy: S1: $4,331.69 (Session Low) |
S2: $4,269.20 (Middle Bollinger Band & Structural Flip) |
S3: $4,155.15 |
S4: $4,041.10 |
Invalidation Floor: $3,927.05
Confluence & Technical Indicators: Moving Average Alignment: The short-to-medium-term moving average ribbon has executed a bullish cross beneath spot prices, providing dynamic structural support.
Fibonacci Confluence: The recovery from
$3,927.05 to
$4,334.64 represents a 50% retracement of the broader
$4,839.45–$3,927.05 decline. Clearing
$4,383.25 exposes the 61.8% golden ratio retracement near
$4,491.00–$4,497.30.
Volatility Bands & RSI: Bollinger Bands are expanding upward with price riding the upper band. Relative strength momentum is rising steadily without entering overbought territory, indicating capacity for further upside discovery.
Strategic Market Outlook: Bullish Expansion Scenario: As long as Gold defends the
$4,269.20 support floor, a daily close above
$4,383.25 will pave the way toward
$4,497.30, with a multi-week continuation target positioned at
$4,611.35.
Bearish Rejection Scenario: A failure to hold
$4,269.20 would signal a fakeout, risking a deeper corrective retest toward
$4,155.15 and
$4,041.10, with
$3,927.05 serving as the absolute macro invalidation level.
*The market analysis posted here is meant to increase your awareness, but not to give instructions to make a trade
 Italiano
 Русский
 English
 Bahasa Indonesia
 Bahasa Malay
 ไทย
ไทย Español
 Deutsch
 Български
 Français
 Tiếng Việt
 中文
中文 বাংলা
বাংলা हिन्दी
 Čeština
 Українська
 Română
