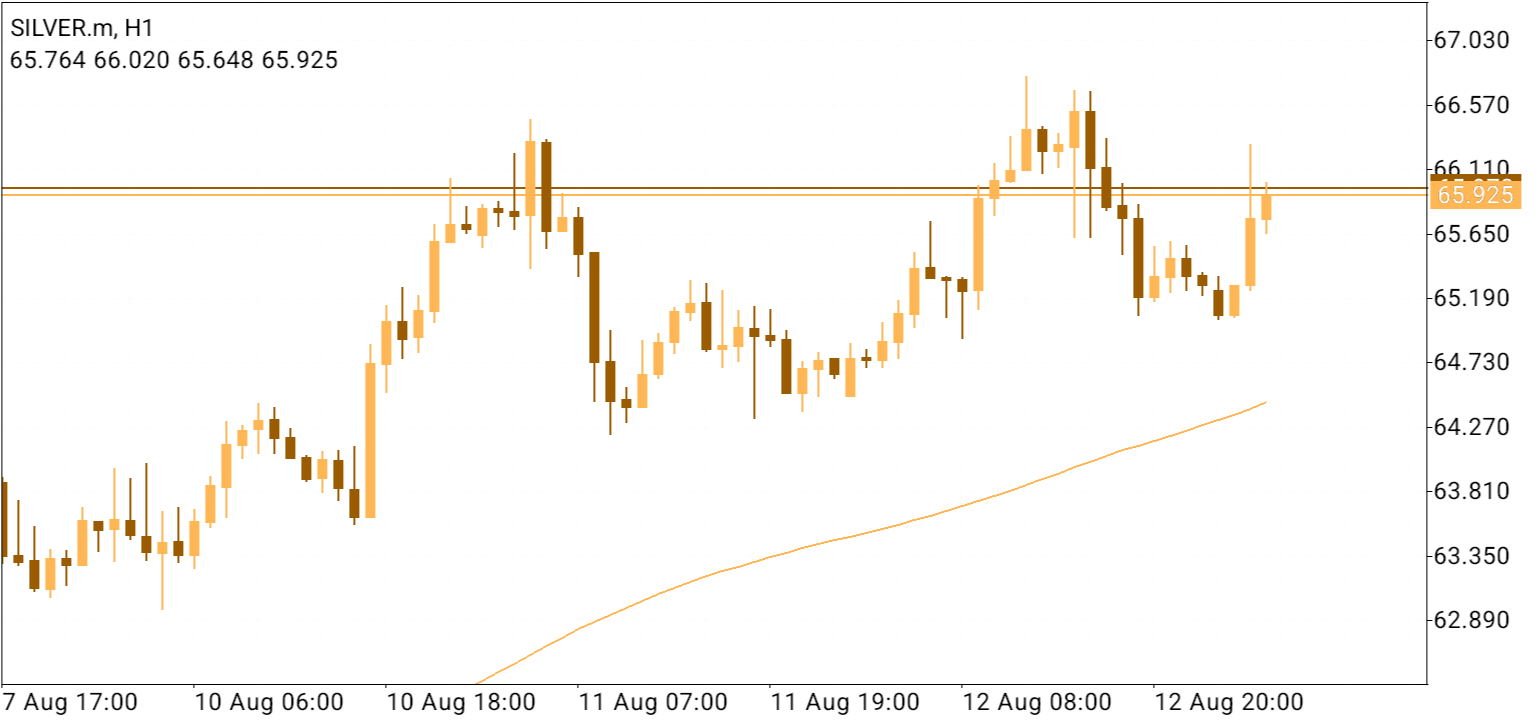
SILVER.m H1 Technical Analysis: Silver Re-engages Pivotal 65.925 Level via V-Shaped Liquidity Sweep Market Structure & Multi-Day Price Action A detailed structural breakdown of the 1-hour chart for Silver (SILVER.m, H1) reveals an established bullish trend characterized by high volatility and macro range expansions. Following a steady climb early in the sequence, the asset carved out a local peak near 66.300 on August 10 before pulling back to find deep value support around the 64.400 liquidity zone. Buyers aggressively defended this area, staging a strong recovery that drove price action up to print new macro highs near 66.800 on August 12. Although a sharp corrective wave subsequently dropped price back down to 65.000 to flush out weak hands, an abrupt influx of buying volume has triggered a near-total V-shaped reversal back into the upper boundaries of the range. Critical Levels & Horizontal Pivot Interaction The focal point of the technical configuration in 69232.png is the orange horizontal pivot line positioned at 65.925. This level marks a major historical junction across the multi-day chart: Historical Range Threshold: It acted as a key breakout boundary on August 10 and a crucial retest zone during the early August 12 upside expansion. Current Intraday Interaction: Following the recent drop to 65.000, the explosive hourly recovery candle slammed straight back up into this level. The latest hourly print shows price actively compressing right at 65.925, indicating heavy order absorption as bulls attempt to solidify a decisive structural reclaim. Moving Average & Momentum Integration Integrating the technical indicators, the dynamic moving average confirms that the broader medium-to-long-term trend remains firmly supported by the bulls. The moving average is maintaining a smooth, healthy ascending slope underneath the price action, currently rising through the 64.400 region. Even during the steepest pullbacks on August 11 and August 12, price action stayed comfortably insulated above this dynamic line. This positive alignment indicates that despite intense localized volatility and rapid range rotations, the macro market momentum continues to lean to the upside. Forward Trading Scenarios & H1 Outlook As Silver challenges the 65.925 horizontal junction, traders should monitor two primary outcomes for upcoming sessions: Bullish Reclaim & Expansion Continuation: A sustained hourly candle close above 65.925 will validate the strength of the V-shaped recovery. Securing this line as an established support floor will give buyers the structural leverage needed to target a retest of the recent swing highs near 66.570 and 66.800. Bearish Rejection & Internal Rotation: Conversely, if defensive supply caps the move here, a localized pullback will unfold. A rejection at this horizontal ceiling will likely rotate price lower to test internal demand shelves near 65.650 and 65.190 to gather fresh liquidity before the next major breakout attempt.
Summary > Technical Summary: The SILVER.m H1 chart displays a highly resilient market structure as price completes a rapid recovery to test a critical horizontal pivot at 65.925. Backed by a firmly ascending 1-hour moving average near 64.400, the asset has bounced strongly out of a local liquidity sweep near 65.000. Price is currently compressing right against the 65.925 marker; a clean hourly breakout close above this pivot line will open the way back toward recent highs near 66.800, while a rejection will force a brief consolidation dip back into internal support shelves.
*The market analysis posted here is meant to increase your awareness, but not to give instructions to make a trade
 Italiano
 Русский
 English
 Bahasa Indonesia
 Bahasa Malay
 ไทย
ไทย Español
 Deutsch
 Български
 Français
 Tiếng Việt
 中文
中文 বাংলা
বাংলা हिन्दी
 Čeština
 Українська
 Română
