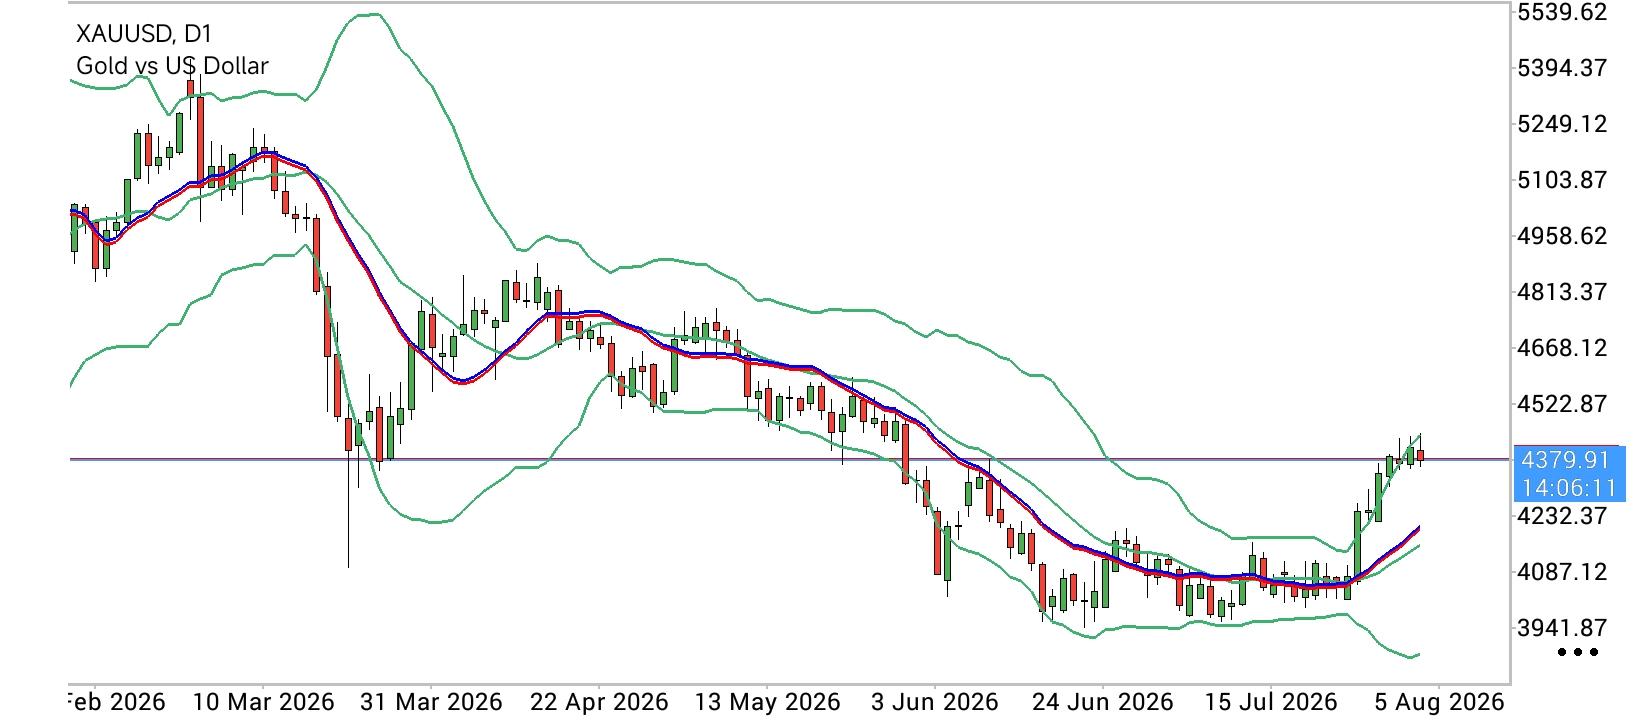
 The "Disinflation vs. Geopolitical Friction" Dynamic: Gold Retreats to $4,408 as Mild US CPI Cooldown Shifts Focus to PPI Flashpoint
 Spot Gold (
XAU/USD) is consolidating around the
$4,408.48 level during Thursday’s Asian trading session after encountering sharp overhead resistance at a fresh ten-week peak of
$4,450.00. The precious metal’s intraday retreat toward the
$4,400.00 psychological floor reflects a brief breather by bullish traders as the market recalibrates ahead of the upcoming U.S. Producer Price Index (PPI) release. Bullion momentum was initially ignited by a benign U.S. Consumer Price Index (CPI) report, which showed headline annual inflation easing to
3.4% in July from June’s 3.5% print, matching consensus expectations. Crucially, the closely monitored core annual CPI print moderated to
2.5%, while monthly core inflation ticked up by
0.2% following a flat reading in June. The cooling inflation data triggered a pronounced sell-off in the U.S. Dollar and Treasury yields, as market participants aggressively dialed back expectations for a Federal Reserve rate hike at the September FOMC meeting. According to the CME FedWatch Tool, the probability of a September rate hike dropped to
40%, down sharply from
54% just a week prior. Analysts at TD Securities emphasized that the mild inflation readings should "continue to bring relief to the Fed regarding the need for tighter policy, at least in the near horizon," pointing to service-sector price normalization and controlled tariff pass-through. On this basis, TD Securities reiterates its baseline projection that the Fed will keep its policy stance unchanged through the remainder of the year. However, the initial market enthusiasm was tempered by renewed geopolitical uncertainty in the Middle East. Reports from senior Iranian diplomatic sources indicated a standstill in negotiations aimed at reviving the June interim agreement regarding the
Strait of Hormuz. In response, U.S. President Donald Trump posted on Truth Social claiming "total control" over the strategic waterway, dismissing Tehran's statements as "fake news" and asserting that Iran is "the Bully of the Middle East No Longer." Coupled with retreating crude oil prices, these conflicting headlines triggered profit-taking near
$4,450.00, leaving gold traders looking to the U.S. PPI release for definitive confirmation of the disinflation trend before launching the next leg higher.
Technical Trend Structure: The $4,387.53 "100-Day SMA Shelf" and the $4,502.95 "200-Day Ceiling" On the daily chart,
XAU/USD maintains a strong bullish near-term structure, trading comfortably above its short- and medium-term moving average cluster while reclaiming former resistance zones as support.
The $4,502.95 "Macro Upside Barrier": Primary long-term overhead resistance is defined by the
200-day Simple Moving Average (SMA) at
$4,502.95. A decisive daily close above this level validates a structural trend expansion toward new record highs.
The $4,387.53 "Reclaimed Demand Shelf": Immediate structural support rests at the
100-day SMA at
$4,387.53. Holding above this node preserves the immediate bullish momentum. Deeper secondary support is anchored by the
21-day SMA (
$4,151.01) and
50-day SMA (
$4,146.69) dynamic cluster.
Momentum Oscillators: The 14-day Relative Strength Index (RSI) stands at
67.49. While flirting with overbought territory, it confirms robust buying pressure without yet signalling immediate trend exhaustion.
Strategic Trading: Decision Nodes and Structural Levels: Signal Type Entry Trigger Primary Target (TP) Protective Stop (SL) Tactical Rationale Bullish Breakout Daily Close >
$4,452.00 $4,502.95 / $4,550.00 $4,410.00 Momentum continuation play following soft PPI confirmation and Fed rate-hike repricing.
Dip-Buy Rebound Reversal at
$4,388.00 $4,450.00 / $4,502.95 $4,360.00 Accumulation at the reclaimed 100-day SMA demand shelf during intraday risk-off pullbacks.
Key Tactical Milestones: Immediate Resistance: The ten-week high at
$4,450.00, followed by the 200-day SMA target at
$4,502.95.
Critical Support: The 100-day SMA at
$4,387.53, followed by the primary dynamic trendline floor at
$4,151.01.
*The market analysis posted here is meant to increase your awareness, but not to give instructions to make a trade
 Italiano
 Русский
 English
 Bahasa Indonesia
 Bahasa Malay
 ไทย
ไทย Español
 Deutsch
 Български
 Français
 Tiếng Việt
 中文
中文 বাংলা
বাংলা हिन्दी
 Čeština
 Українська
 Română
