 Gold Daily Forecast
 Gold (XAU/USD) declined by over $100 from its highest price since June 5. Observed earlier today, prices stayed bearish in the vicinity of the $4,375-$4,370 area throughout the early part of the European trading session. The initial market response to indications of easing inflation pressures in the United States quickly faded. Investors' concerns over the possibility of resurging inflationary pressure due to increasing energy costs continue. This is supportive of the prospect of interest rate increases by the US Federal Reserve (Fed) in 2026, which is viewed as providing a boost to the US Dollar (USD) and drawing flows out of the non-yielding precious metal. According to Wednesday's report by the US Bureau of Labor Statistics. The US headline CPI was in line with market expectations, declining from 3.5% to 3.4% YoY in July. The core figure, excluding the volatility-prone food and energy costs, advanced 0.2% and 2.5% MoM and YoY, respectively, in line with forecasts. In addition to Friday's US NFP figures, this data provides extra room for the Fed to maintain interest rates unchanged in September, which supported gold. Investors are still concerned about the risks of inflation from fluctuations in oil prices in light of the US-Iran conflict. President Donald Trump made another statement that the US has "total control" over the Strait of Hormuz. Iran said that it would keep the strategically important strait closed until all demands are fulfilled. Iran-supported Houthis in Yemen upped the ante by mounting attacks on ships in the Red Sea and Bab el-Mandeb Strait, aiming at vessels belonging to Saudi Arabia. As a result, the war risk is rising, thus supporting crude oil prices. It adds fuel to the fears of inflation, thus making the case for a Fed rate hike even more compelling, according to the CME Group FedWatch Tool. Traders are still putting odds of almost 80% that the US central bank will increase the cost of borrowing in 2026. This helps the USD Index (DXY) consolidate the rebound from the low after CPI readings and reach a two-week high. This is putting additional downward pressure on gold. Besides, a break below the level of $4,400 supports the idea of a short-term correctional move down from the two-month high.
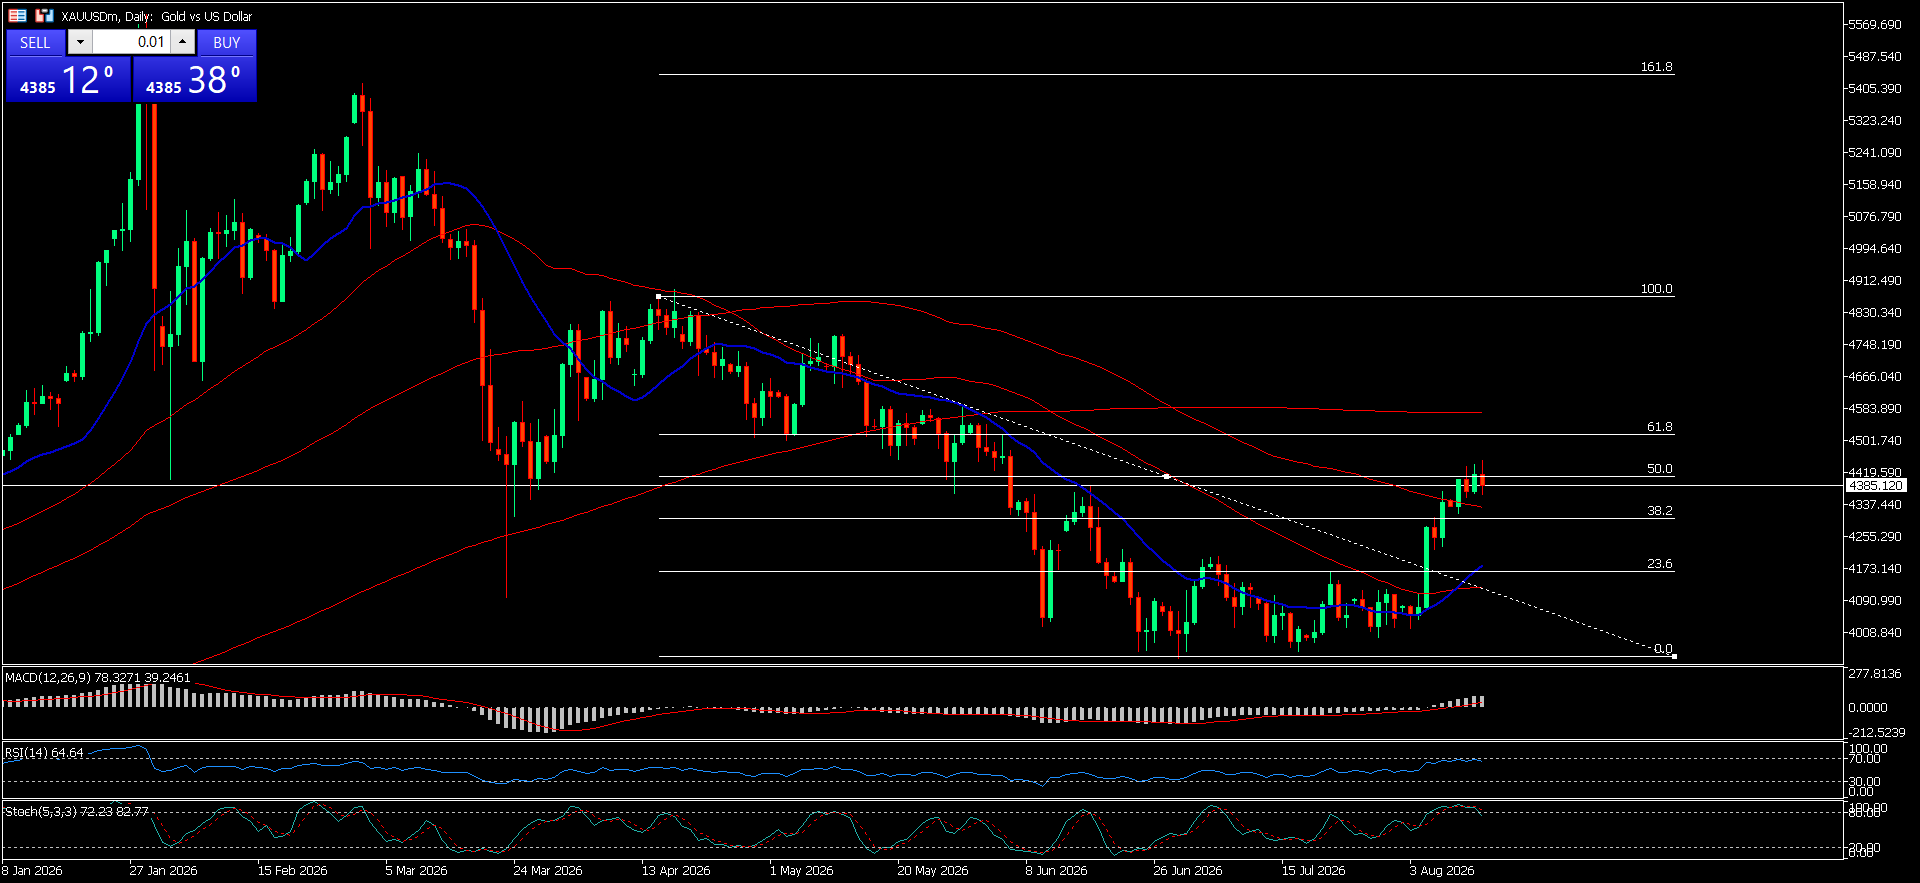
Well, as of now, Gold on the daily chart is trading under bearish sentiment below the 4400$ at 4392$. The buyers are still facing a strong resistance zone from 4435$ to 4475$. However, prices closed above the 100-SMA yesterday but could not maintain momentum towards 4500$. Indeed, any subsequent move beyond the 50% retracement level of the April-June downfall would be favourable for gold buyers. Since the Asian session gold drop, its momentum is around 0.38%. The Moving Average Convergence Divergence (MACD) indicator remains elevated, which suggests constructive momentum in gold prices. On the other hand, the RSI Relative Strength Index) is hovering near 65.40, near the overbought region. This situation suggests that the bullish momentum persists in the pair. The recent bullish bias in the yellow metal (Gold) is influenced by multiple factors like geopolitical and economic factors. Hence, if the buyers regain strength and continue bullish momentum. The breakout of yesterday's high 4451$, would strengthen beyond the daily swing high. This might face the initial resistance barrier near the 200-day SMA at $4,502. If the price surpasses the 200-day SMA at $4,502, the next nearby target would be the 61.8% retracement at $4,525.18. The piercing resistance roof of 4,525.18 could motivate buyers to climb the next barriers at $4,683 and $4,885. On the negative side, the recent consolidation below the 4400$ could indicate the buyers' weakness. If the sellers drag the bearish bias below the 100-day SMA at 4333$ could bring more fresh selling pressure. Thus, gold prices extend their decline towards the 38.6% retracement level at $4,302. At this stage, we can see some fresh buying pressure. If the retracement fails to strengthen. Another strong bearish leg could extend towards the 23.6% level at $4,164.38, which is also protected by the 50-SMA. However, if the sellers find footholds below the 23.6% Fibonacci retracement level, another more significant structural floor would emerge near $3,941.47.
*The market analysis posted here is meant to increase your awareness, but not to give instructions to make a trade
 Italiano
 Русский
 English
 Bahasa Indonesia
 Bahasa Malay
 ไทย
ไทย Español
 Deutsch
 Български
 Français
 Tiếng Việt
 中文
中文 বাংলা
বাংলা हिन्दी
 Čeština
 Українська
 Română
