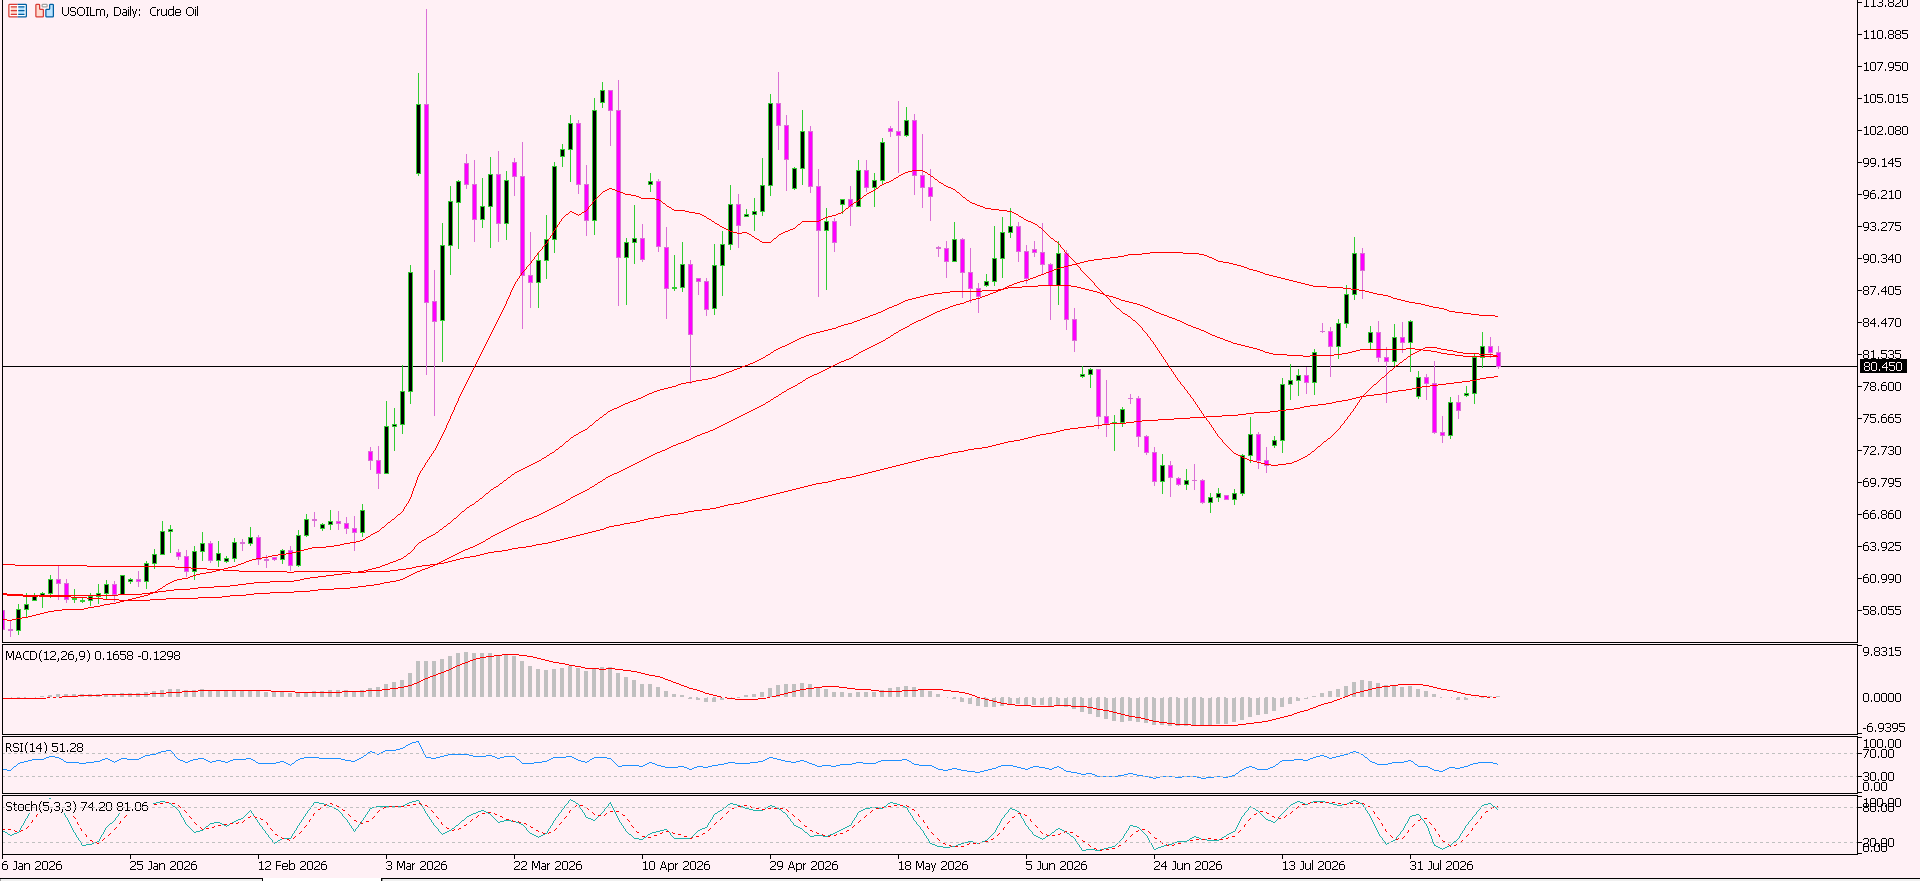
 WTI Oil Price Forecast: Crude Oil Slips as Weak Demand Outlook Counters Middle East Supply Risks
 West Texas Intermediate (WTI) Oil prices have declined somewhat Thursday amid weighing weak global demand outlooks against risks posed by geopolitical tensions in the Middle East region. The WTI price currently stands at about $80.50 a barrel, posting a fall of roughly 1.35% on the day. However, WTI losses have been kept under pressure amid ongoing concerns about disruptions at the Strait of Hormuz. There are no indications that the Strait of Hormuz will be reopened anytime soon, given that both the US and Iran claim control over the strategically important route. Shipping activities have sharply declined compared to what was witnessed prior to the outbreak of hostilities. WTI has failed to post further declines amid weak demand forecasts by key oil organizations due to a geopolitical risk premium. The Organization of Petroleum Exporting Countries (OPEC) has revised its forecast for Oil demand growth in 2026 downward. Now, the organization expects that demand will grow by 580,000 barrels per day, which is significantly less than its previous prediction of 780,000 barrels per day. The International Energy Agency (IEA), in contrast, has a very pessimistic forecast and expects that Oil demand will fall by 1.6 million barrels per day during the same year. These two contradicting predictions show how worried people are about future energy consumption, which may negatively affect prices in case of any disruptions on the supply side. In terms of technical analysis, WTI shows a neutral momentum pattern amid growing volatility. Specifically, in the daily time frame, the price has a slight bearish trend but stays below the 20-day Bollinger Band Simple Moving Average at $81.63. Moreover, Bollinger Bands have expanded, meaning that the volatility is increasing. The upper band is currently at $90.13, while the lower one is at $73.12. Momentum oscillators give little indication of future movement. RSI has stayed in close proximity to the neutral 50 mark, implying that neither buyers nor sellers have dominated the market yet. MFI, on its part, is drifting sideways near the zero line. Both indicators show that WTI lacks direction despite volatility being high. As such, traders should remain on alert for potential breaks of key technical levels to determine the next movement. In the upside, the 20-day SMA of $81.63 stands out as the first resistance level. Any break above this resistance could enhance the current upward movement and see the upper Bollinger Band of $90.13 tested. Any further selling, on the other hand, could see WTI head towards the lower Bollinger Band of $73.12 as the next support level. Currently, a lack of buying interest is dragging Oil lower while Middle Eastern worries are limiting any losses.
*The market analysis posted here is meant to increase your awareness, but not to give instructions to make a trade
 Italiano
 Русский
 English
 Bahasa Indonesia
 Bahasa Malay
 ไทย
ไทย Español
 Deutsch
 Български
 Français
 Tiếng Việt
 中文
中文 বাংলা
বাংলা हिन्दी
 Čeština
 Українська
 Română
