 Ethereum Price Analysis: ETH/USD Triangle Breakout Setup, Key Support and Resistance Levels Market Structure
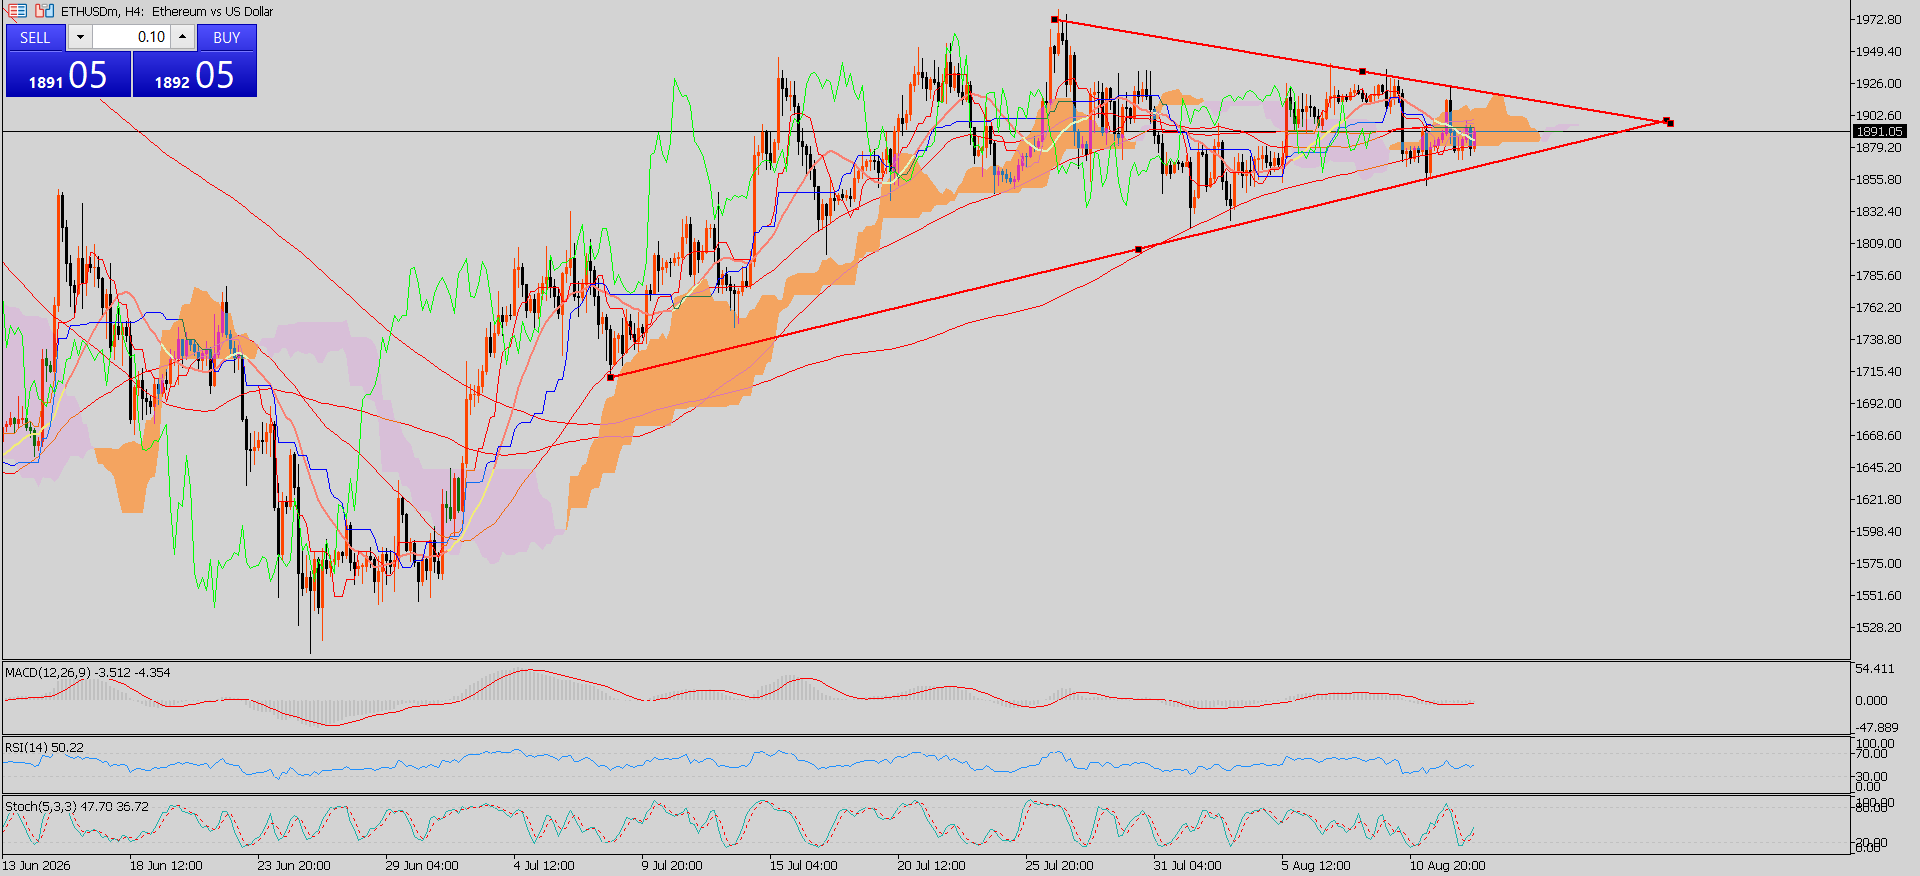
 At the moment, Ethereum is trading in a symmetrical triangle pattern on the four-hour chart after the recovery recorded in June and July, which is marked by price action compression. The higher lows are established by price action along the rising trend line, while the upper level is keeping prices contained at levels ranging from $1,900 to $1,930. The price of Ethereum, which is trading at $1,891, is showing that there is indecision between buyers and sellers.
Triangle Resistance The first resistance is at $1,902; this is the level where the falling trend line touches the current consolidation level. Any four-hour close above $1,902 will mark the beginning of the breakout. The other levels of resistance are at $1,926 and $1,973, which is the high recorded in July.
Key Support Levels The ascending trendline provides a supportive base at $1,870-$1,880, and this becomes very important for the continuation of the bullish scenario. Any break below $1,870 will see the next critical zone of support at $1,855 and $1,809, near the support on the deeper trendline. A break below $1,809 will weaken the reversal structure, and focus will shift towards $1,738. Until the $1,870 support holds, there are chances for buyers to defend the uptrend.
Ichimoku Cloud The Ichimoku Cloud provides a mixed to slightly bearish setup on the short-term period. Price action is trading within the cloud formation, and the forward cloud remains flat and thin in nature, showing the absence of any directional bias. The cloud, ranging between $1,890 and $1,925, becomes the congestion and resistance zone. A breakout above the cloud will be positive for the bulls, while a breakdown from the cloud becomes resistance.
Momentum Indicators The momentum indicators are indicating a neutral bias. The MACD momentum indicator is hovering around the zero line, implying that neither buyers nor sellers dominate. The RSI momentum indicator at 50.22 also confirms neutral momentum. In the same way, the stochastic momentum indicator is also near its midpoint at 47.70. These readings confirm the pattern analysis and increase the importance of the breakout.
Bullish and Bearish Scenarios The bulls have to surpass $1,902, followed by a robust acceptance above $1,926, to reach their target price of $1,973 and even the psychologically important price level of $2,000. Failure to surpass $1,902 will see the price move downwards to $1,870. Breaking below $1,855 will build selling momentum, while failing to hold the $1,809 price level will be confirmation of the correction to $1,738.
Technical Outlook ETH/USD remains technically trapped as the triangle formation comes to completion. The upward-sloping support line holds the medium-term technical outlook positive for the asset, but a test of $1,902 and $1,926 levels is needed to gain additional upside impetus. Failure to break out above the resistance may result in a prolonged consolidation phase that may become negative at a later stage. The prevailing market environment is suitable for playing the waiting game as both momentum and volatility are neutralized.
*The market analysis posted here is meant to increase your awareness, but not to give instructions to make a trade
 Italiano
 Русский
 English
 Bahasa Indonesia
 Bahasa Malay
 ไทย
ไทย Español
 Deutsch
 Български
 Français
 Tiếng Việt
 中文
中文 বাংলা
বাংলা हिन्दी
 Čeština
 Українська
 Română
