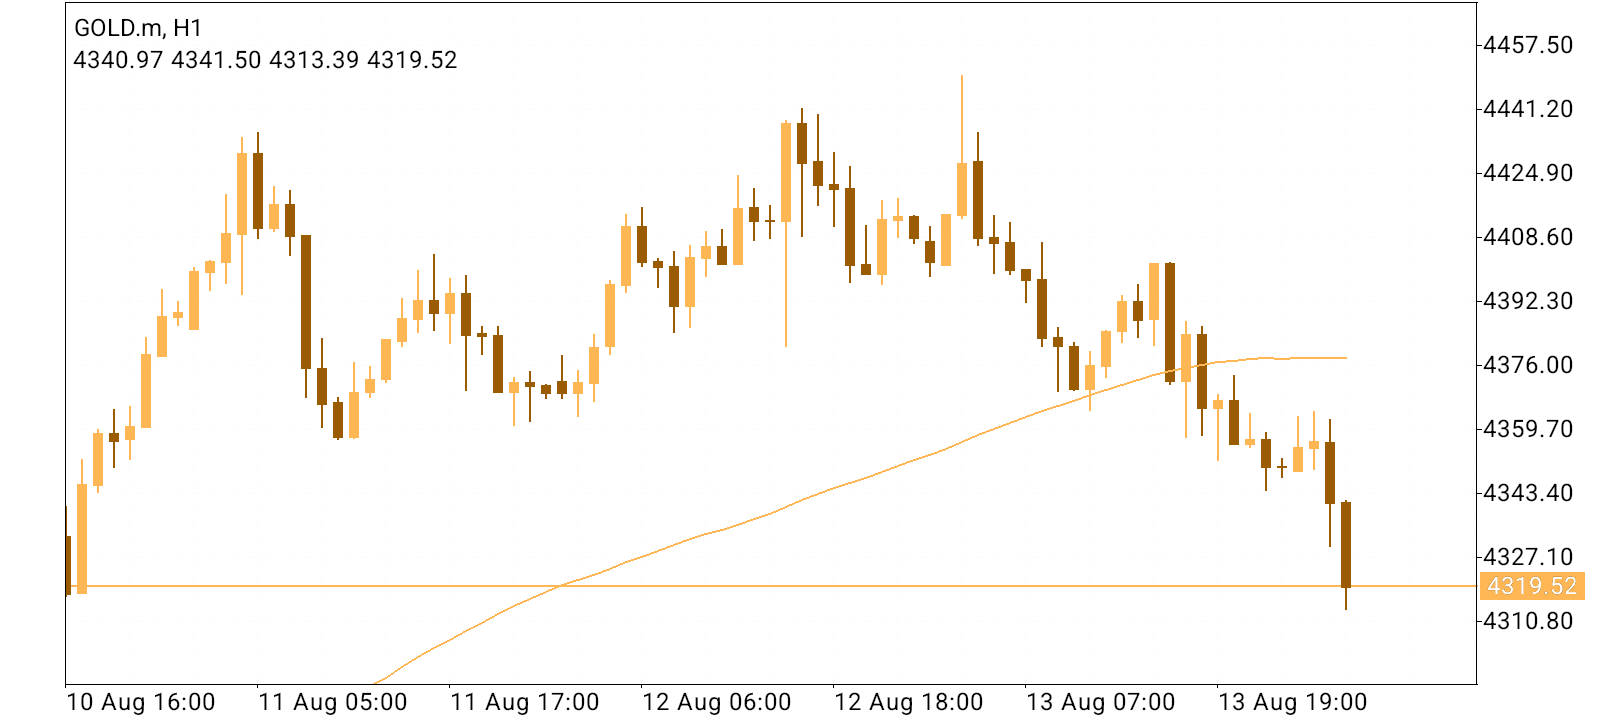
GOLD H1 Technical Analysis: Gold Suffers Aggressive Breakdown Below Moving Average to Test Multi-Day Base at 4319.52 Market Structure & Multi-Day Price Action A comprehensive structural review of the 1-hour chart for Gold (GOLD.m, H1) in 69603.png shows a decisive shift from a macro bullish structure into an active corrective decline. After establishing a sequence of peak highs near the 4441.20 and 4457.50 tiers between August 10 and August 12, the asset met heavy institutional distribution. The subsequent decline across August 12 and August 13 broke through intermediate higher lows, establishing a clear pattern of lower highs and lower lows. Aggressive selling pressure accelerated during the August 13 sessions, driving price action decisively beneath its medium-term support zones and extending the downside expansion toward macro value areas. Critical Levels & Horizontal Pivot Interaction The primary technical anchor point in 69603.png is the orange horizontal pivot line positioned at 4319.52. This boundary carries significant structural weight across the multi-day layout: Historical Structural Floor: It represents a major historical base that originally launched the early expansion wave seen on August 10. Current Intraday Retest: Following the sharp sell-off candle on August 13, price sliced through internal support shelves to plunge straight into this level. The latest hourly candle printed an intraday sweep wick down to 4313.39 before pulling back slightly to compress right around the 4319.52 threshold, illustrating an active attempt by buyers to mount a defensive stand at this macro floor. Moving Average & Momentum Integration Integrating the technical indicators present in 69603.png, the dynamic moving average confirms a strong bearish momentum shift on the H1 timeframe. The moving average is flattening and beginning to slope downward near the 4376.00 area, positioned well above current price action. During the August 12–13 decline, the price action forcefully broke beneath this dynamic baseline, transforming what was previously a reliable trailing support line into a major overhead resistance barrier. This positioning confirms that sellers currently maintain firm control of the short-to-medium-term market velocity. Forward Trading Scenarios & H1 Outlook As Gold interacts directly with the 4319.52 horizontal pivot junction, market participants should watch two primary technical developments over upcoming sessions: Bullish Defense & Counter-Trend Relief: A successful defense and sustained hourly candle close above 4319.52 will signal a valid liquidity sweep of the August 10 low. Holding this floor could spark a short-term relief rally, rotating price higher toward internal resistance nodes at 4343.40 and 4359.70 to test the supply trailing beneath the dynamic moving average. Bearish Breakdown & Trend Extension: Conversely, if selling pressure continues to overwhelm demand and forces a decisive hourly close beneath 4319.52, it will confirm a major structural breakdown. Converting this baseline into overhead resistance will likely unlock further downside expansion, targeting lower liquidity pools near the 4310.80 level and beyond.
Summary Technical Summary: The GOLD.m H1 chart in 69603.png reveals a strong corrective shift as price breaks through multiple support layers to retest a multi-day horizontal baseline at 4319.52. Trading well underneath a flattening 1-hour moving average near 4376.00, short-term momentum favors the sellers following the sell-off from 4441.20 peaks. Price recently swept lower liquidity down to 4313.39 and is now compressing on top of the 4319.52 pivot floor; a confirmed hourly hold here is necessary to trigger a relief bounce, whereas a clean breakdown close will extend the decline toward 4310.80.
*The market analysis posted here is meant to increase your awareness, but not to give instructions to make a trade
 Italiano
 Русский
 English
 Bahasa Indonesia
 Bahasa Malay
 ไทย
ไทย Español
 Deutsch
 Български
 Français
 Tiếng Việt
 中文
中文 বাংলা
বাংলা हिन्दी
 Čeština
 Українська
 Română
