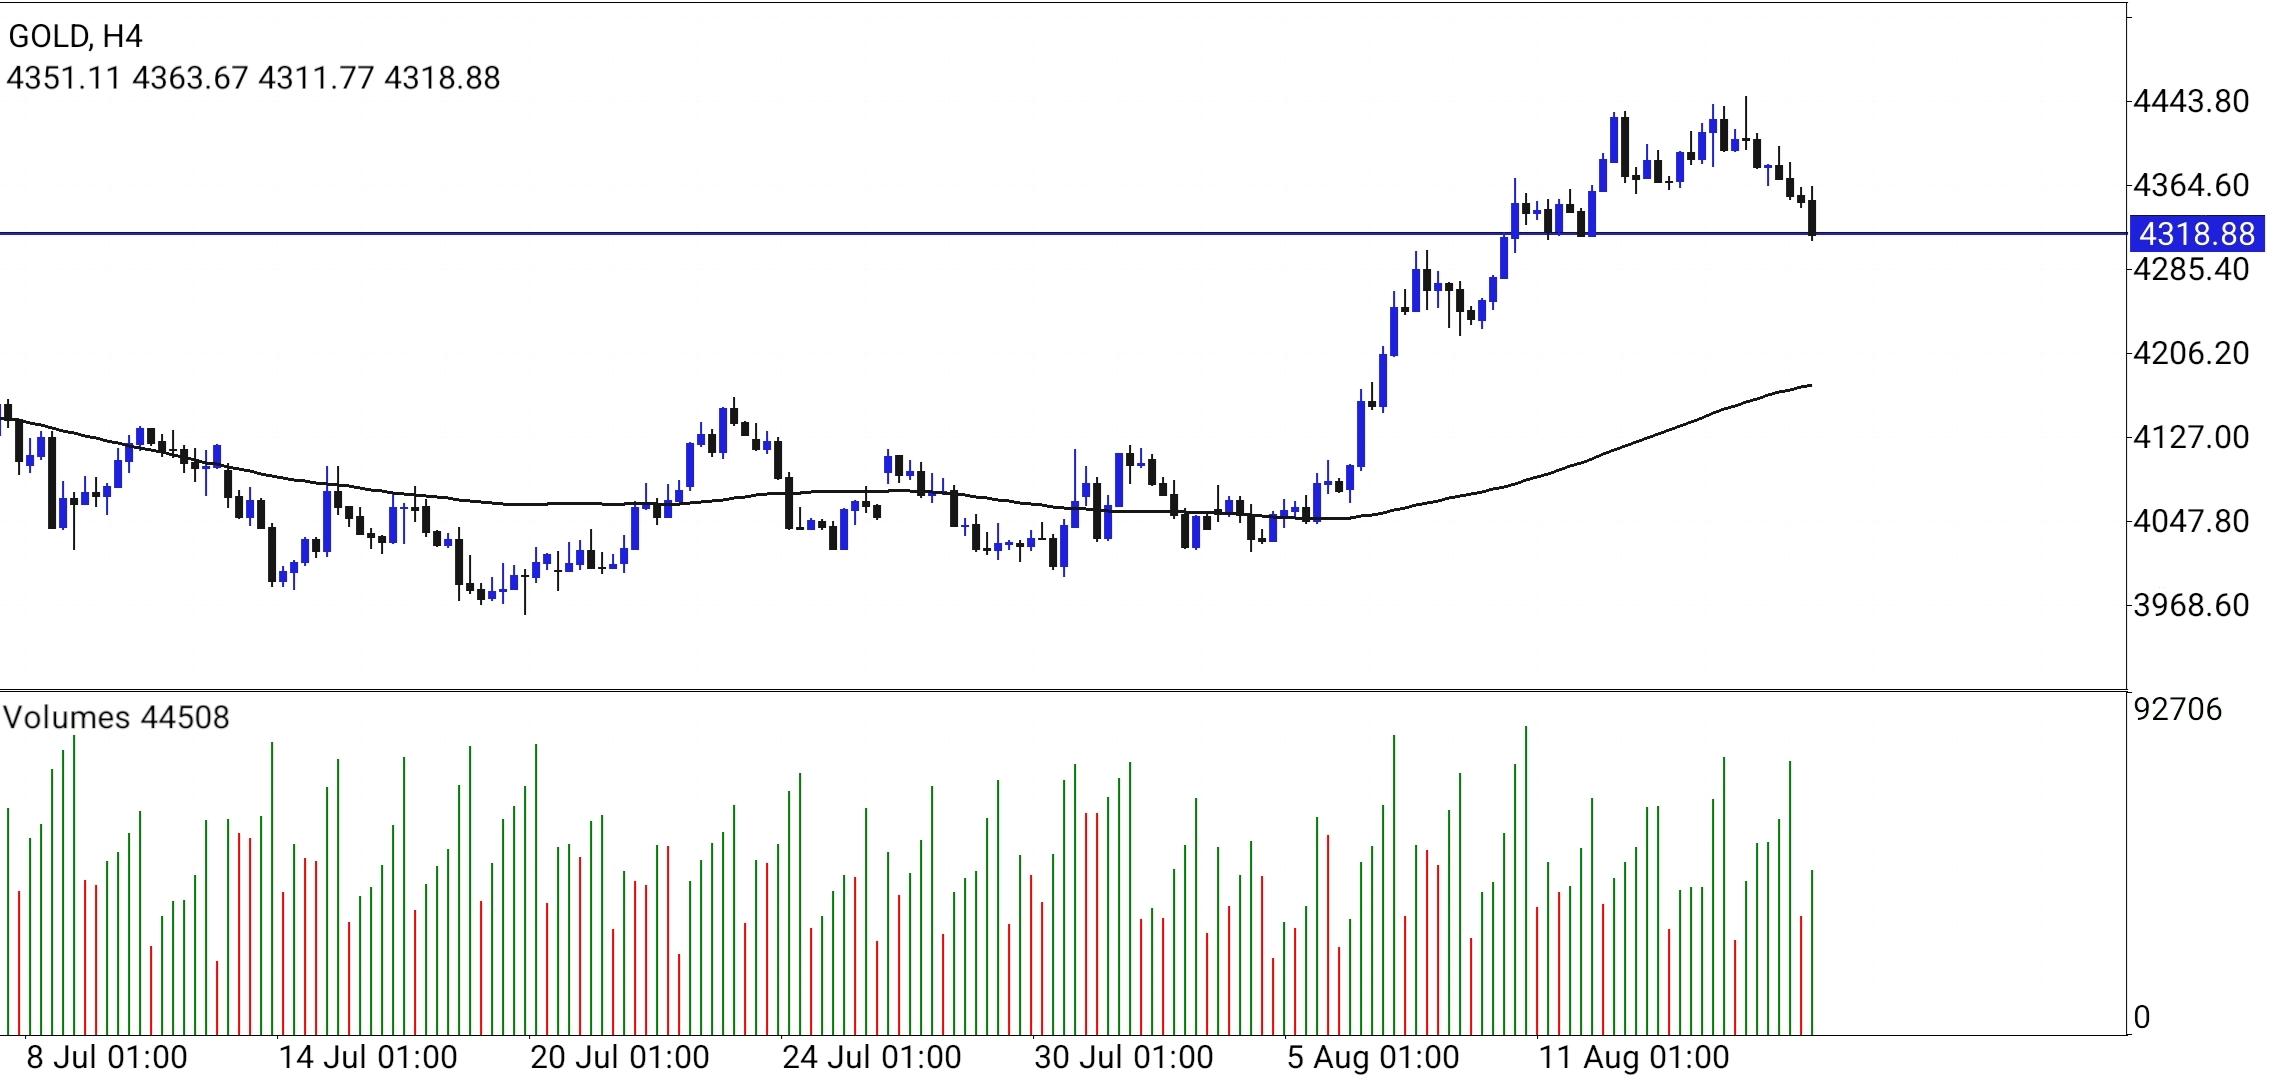
 Technical Overview of Gold on the H4 Timeframe
 The 4-hour (H4) chart for Gold (XAU/USD) displays a significant multi-week upward expansion followed by a notable short-term correction near technical resistance. Looking closely at the market structure, price action spent late July consolidating within a broad range before launching into an aggressive bullish impulse starting around August 5. This impulsive advance drove prices steadily upward, carving out successive higher highs and higher lows while maintaining a healthy distance above the rising baseline moving average shown on the chart.
Price Action and Key Levels At present, the market is undergoing a corrective retracement from recent highs near the 4443.80 region down toward the crucial horizontal inflection line resting at 4318.88. This specific horizontal level has historically served as a vital zone of market interest, alternating between support and resistance roles.
Immediate Support Zone: The 4318.88 horizontal level represents the primary line in the sand for bulls. A successful defense of this area could pave the way for a continuation of the primary uptrend.
Resistance Barrier: Overhead resistance is firmly established near the recent swing peaks around 4443.80. A decisive breakout above this ceiling would expose further upside expansion.
Moving Average Dynamic Support: The underlying smooth moving average continues to trend upward beneath current price action, offering secondary dynamic support and reinforcing the broader bullish market bias.
Volume Analysis Evaluating the volume pane at the bottom of the chart reveals important clues regarding market participation during this retracement phase. During the initial bullish legs upward, volume spikes accompanied the impulsive green candles, indicating strong institutional buying interest and conviction behind the primary trend. However, as the price retreats toward the 4318.88 support level, the accompanying volume bars show a relative contraction in selling pressure. This decrease in volume on the downward candles suggests that the current pullback is corrective in nature rather than an aggressive shift in market control by sellers. It highlights a lack of heavy distribution, implying that large market participants are currently holding positions or waiting for a clearer signal at structural support.
Outlook and Potential Trading Scenarios Two primary scenarios stand out for swing traders and intraday participants monitoring this H4 setup:
Bullish Continuation: If price action stabilizes right at the 4318.88 horizontal support level and forms a strong bullish reversal candlestick pattern (such as a bullish pin bar or engulfing bar) backed by rising volume, it would signal a high-probability setup to re-enter long positions targeting the recent highs.
Bearish Breakdown: Conversely, should sustained selling pressure drive the market decisively below 4318.88 with high volume expansion, it would suggest a deeper correction toward the rising moving average and lower structural support zones, invalidating the immediate bullish continuation premise. Risk management remains paramount given gold's inherent volatility, requiring traders to employ strict stop-loss parameters below structural swing points.
*The market analysis posted here is meant to increase your awareness, but not to give instructions to make a trade
 Italiano
 Русский
 English
 Bahasa Indonesia
 Bahasa Malay
 ไทย
ไทย Español
 Deutsch
 Български
 Français
 Tiếng Việt
 中文
中文 বাংলা
বাংলা हिन्दी
 Čeština
 Українська
 Română
