 Structure of the Trend
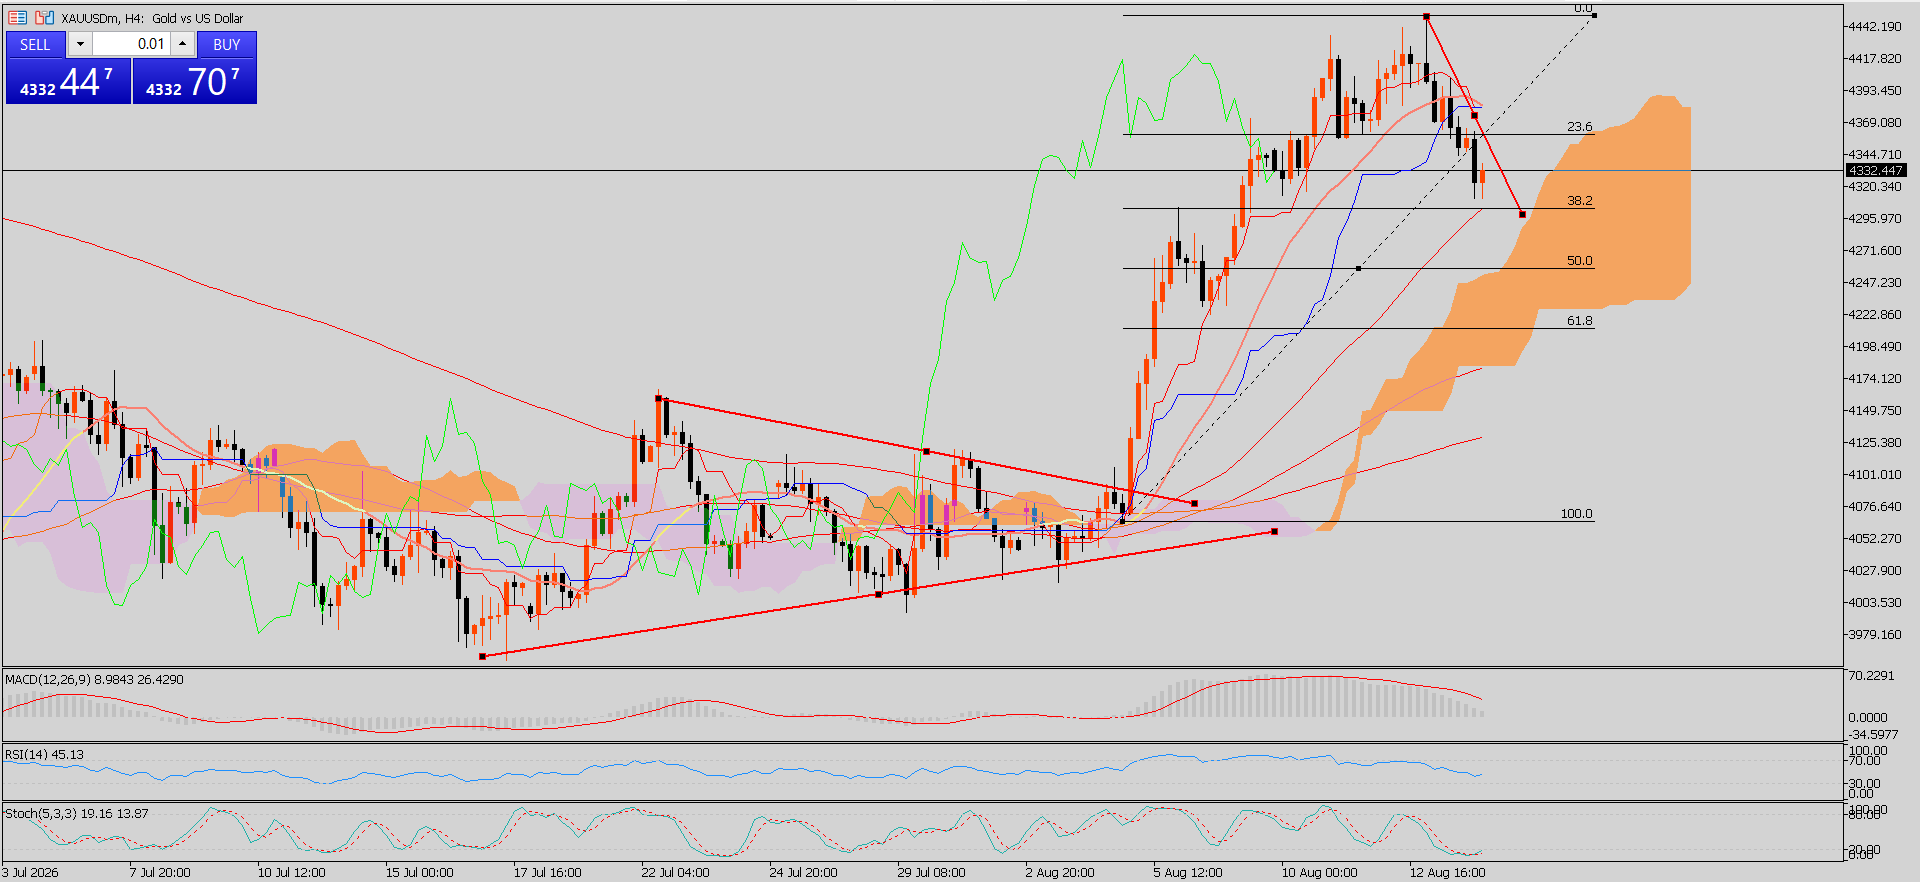
 After the powerful rise towards 4442, gold has found itself in a short-term corrective mode on the four-hour time frame. From the top, the price is falling towards 4332. The overall structure is positive but only provided that the rising trendline from the August breakout holds its ground. The succession of lower peaks points to the weakness of the uptrend momentum.
Levels of the Fibonacci Retracement With the help of the Fibonacci retracement tool, we can determine some levels of corrections. So, the 23.6% level lies around 4369 and the 38.2% around 4296. The 50% level falls around 4260 and the 61.8% level 4219. Staying above 4296 will maintain the overall bullish structure, while a break below 4260 could point to a deeper correction to the 4219 level.
Resistance Regions First resistance lies at 4369, where the level of 23.6% Fibonacci retracement meets the price action on the chart. A break above this level means that buyers have begun dominating and may set the stage to go up towards 4400 to hit the previous high at 4442. A break above 4442 would signify the continuation of upward momentum and signal the start of a new bullish era.
Support Levels 4296 is the primary support region at present; below that is a minor support at 4260, while 4219 will act as an important 61.8% retracement. The rising trend line also acts as additional support below the prevailing price levels. Any break below 4219 in the 4-hour timeframe signals the end of the latest breakout and a corrective period below 4076 to 4100.
Ichimoku Cloud The Ichimoku Cloud stays supportive even as the pullback is currently underway. While price continues trading above the leading cloud, the projection of the cloud still carries a positive sentiment. Nonetheless, the gap between price and cloud is narrowing during the ongoing pullback period. The cloud at 4220 to 4300 may become a relevant support zone, and moving below this area will reduce the signal's bullishness, shifting technical bias into a neutral one.
Momentum Oscillators The momentum oscillators show signs of exhaustion. While the MACD histogram is heading down with its line, this oscillator still prints a positive reading, which indicates weakening but still positive momentum. RSI at 45.13 printed a value that is less than 50, showing weakened momentum while staying away from oversold levels. Stochastic near 19 suggests negative momentum approaching oversold levels.
Technical View The first impression is initially bearish as long as it is below 4369, but the overall picture remains positive as long as it is above 4296 and 4260. A breakout to the upside will have initial targets at 4400 and 4442. On the other hand, a breakdown below 4296 could accelerate the decline toward 4260 and 4219. The problem here is that the bulls need to protect the Fibonacci and the rising trendline support zone. The rally must be treated as a corrective phase unless that level fails.
*The market analysis posted here is meant to increase your awareness, but not to give instructions to make a trade
 Italiano
 Русский
 English
 Bahasa Indonesia
 Bahasa Malay
 ไทย
ไทย Español
 Deutsch
 Български
 Français
 Tiếng Việt
 中文
中文 বাংলা
বাংলা हिन्दी
 Čeština
 Українська
 Română
