 Fundamental Analysis
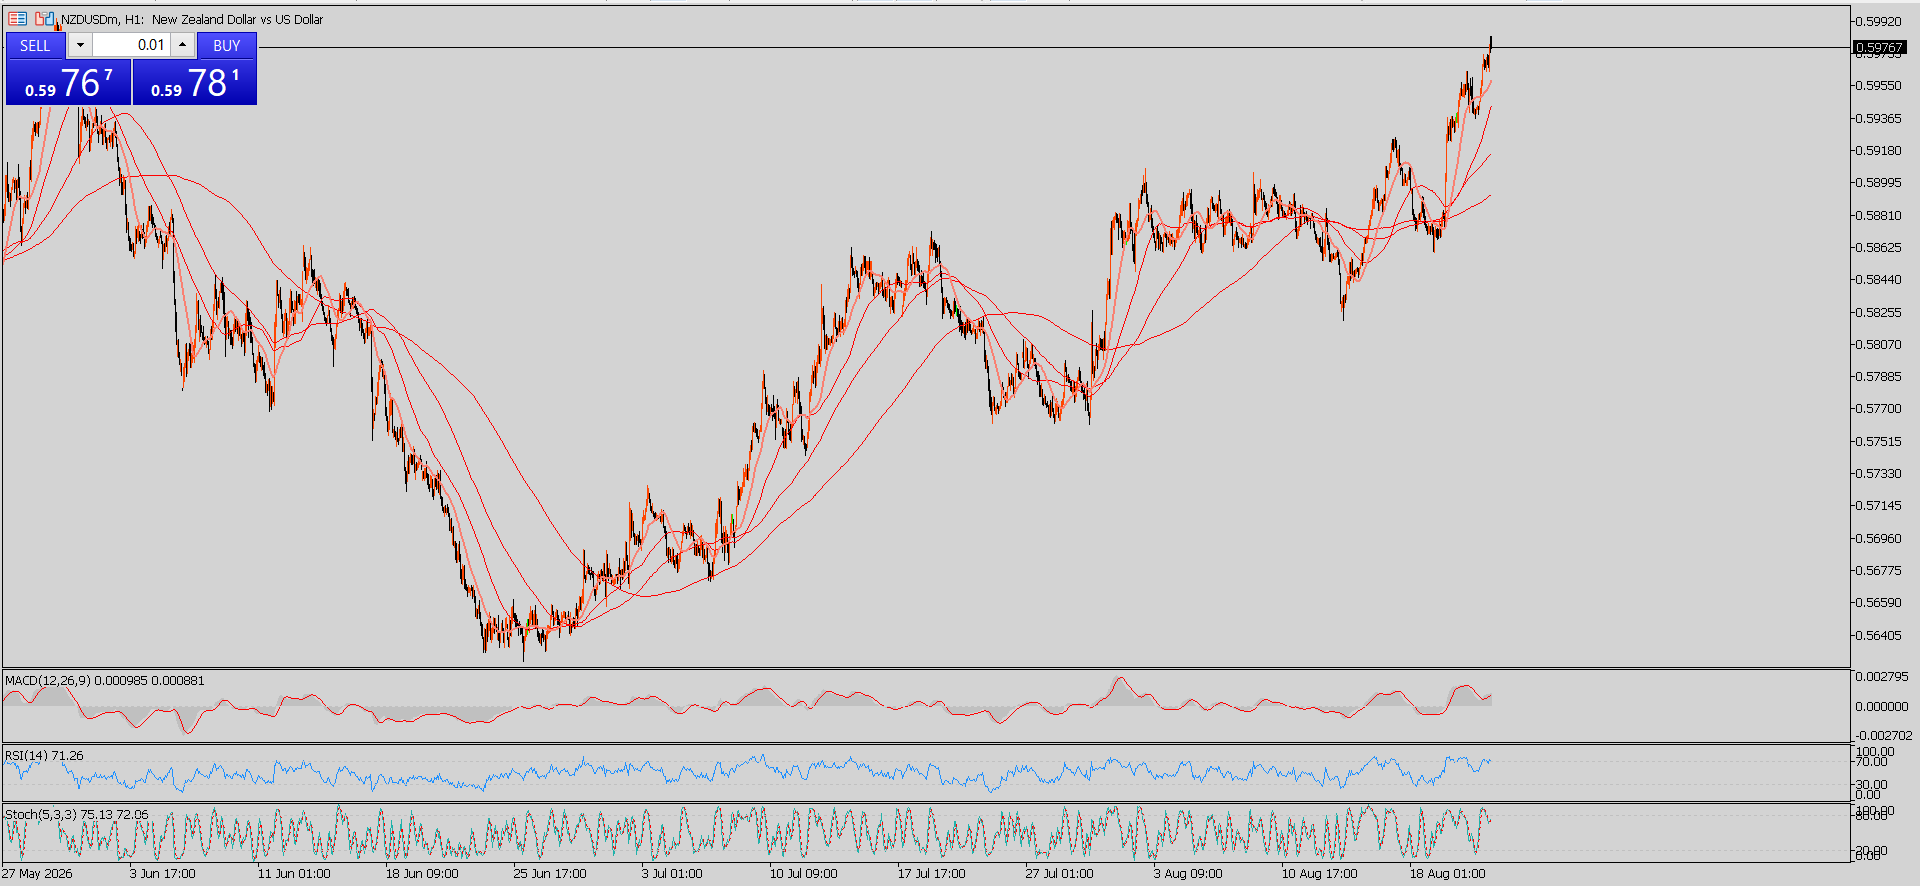
 NZD/USD continues its bullish trend on Friday, trading near 0.5980. At the time of writing, the pair is up 0.62% on the day. The NZD/USD pair has reached its highest level since early June. It looks like the pair has set a solid weekly performance. Primarily owing to weakness in the US Dollar (USD). In today's trading session, the USD Index (DXY), which tracks the performance of the Greenback against a basket of six currencies, has declined 0.23% to 98.65 as of now. The US Dollar comes under further pressure after market expectations for a Fed interest rate rise are pared back. The latest FOMC meeting minutes, however, still held quite a hawkish stance. It was suggested that further tightening might be needed should there be no substantial progress in inflation. Therefore, markets still hope that a rate hike might be considered by the end of the year. Especially given inflation risks stemming from rising oil prices. On the other hand, the New Zealand Dollar (NZD) receives support from the anticipation of another interest rate hike by the Reserve Bank of New Zealand (RBNZ). The difference between the Fed's diminishing chances of action and the expectation of monetary tightening in New Zealand can create an environment for NZD/USD. Recent figures on New Zealand's trade published on Friday did not disrupt this positive momentum. The monthly trade deficit for New Zealand stands at NZ$1,949M in July. Nevertheless, traders do not seem too concerned about developments in monetary policy and the US Dollar. Geopolitical events may restrain the US Dollar's decline. Disagreements between the US and Iran over the Strait of Hormuz continue, adding to inflation expectations amid rising energy costs. The President of the US, Donald Trump, has recently warned about sanctions on Iran and other nations facilitating Iran in breaking US regulations.
Technical Analysis NZD/USD on the hourly timeframe is trading at 0.5979 and continues to trade with an overall bullish bias, despite being above the 100-period SMA at 0.5917 and the 200-period SMA at 0.5894. Additionally, the currency pair continues to trade above an adjacent horizontal level at 0.5960, and an RSI near the overbought region of 72 suggests this move may be exhausted, even though the uptrend remains intact. Negative points, on the other hand, are found with the first support at 0.5960, followed by support levels at 0.5940 and 0.5925. Support at 0.5917 from the 100-period SMA and 0.5894 from the 200-period SMA further underpin this bull setup. Positive factors are evident, with immediate resistance at 0.5995 in the form of a horizontal barrier; a move above this level would see more upside, otherwise leading to corrective moves back towards the indicated support area.
*The market analysis posted here is meant to increase your awareness, but not to give instructions to make a trade
 Italiano
 Русский
 English
 Bahasa Indonesia
 Bahasa Malay
 ไทย
ไทย Español
 Deutsch
 Български
 Français
 Tiếng Việt
 中文
中文 বাংলা
বাংলা हिन्दी
 Čeština
 Українська
 Română
