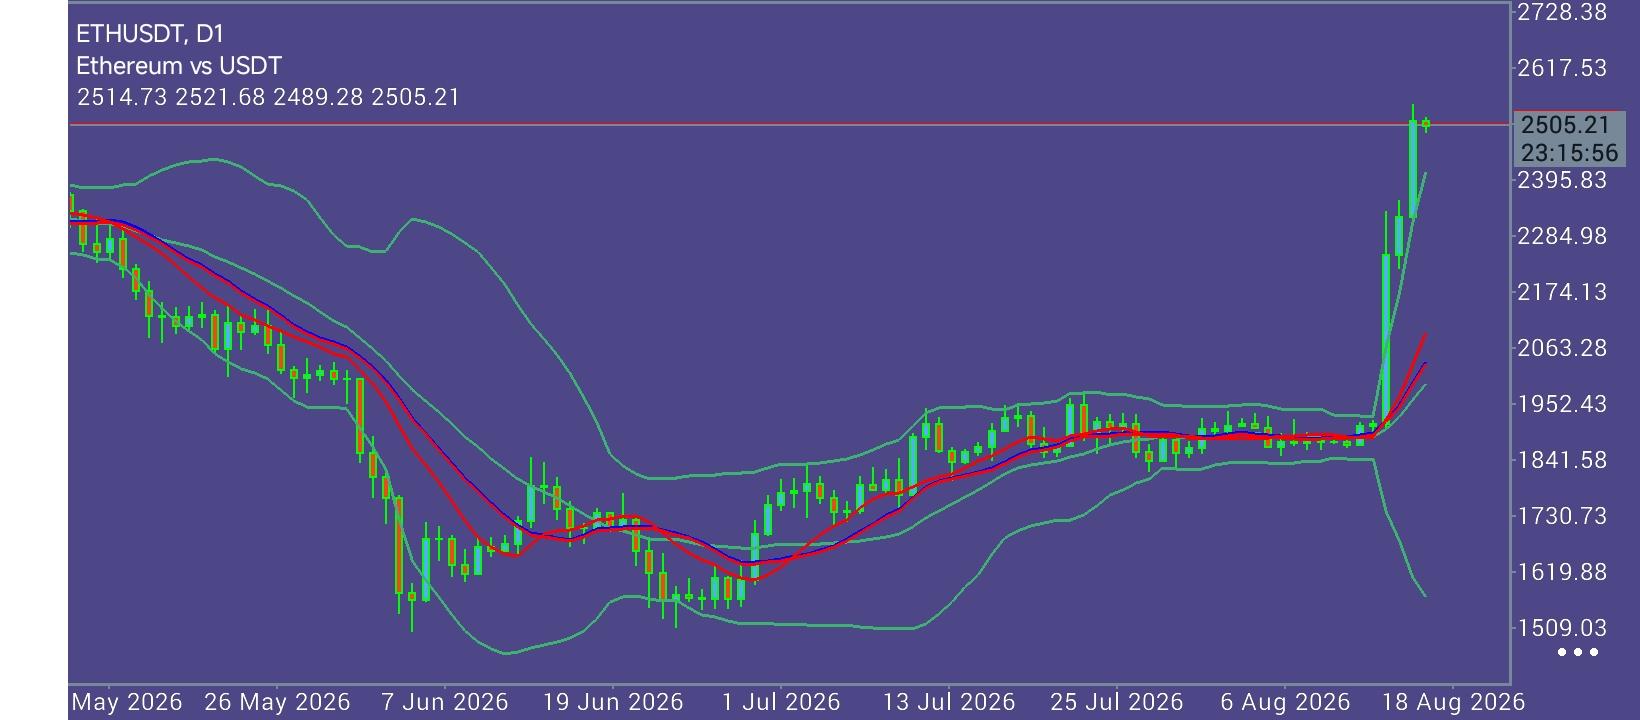
 The "2,431 Gateway": Institutional ETF Inflows and Liquidation Squeeze Drive Ethereum Past $2,500 Ethereum (ETH)
 has surged
8% on Friday to clear the psychological
$2,500.00 threshold, marking its highest valuation since mid-April following an aggressive short squeeze and robust institutional participation. Institutional demand via U.S. spot Ethereum ETFs is on track for a record-breaking week in 2026, registering
$220.7 million in single-day net inflows on Thursday to cap a four-day accumulation streak totaling
$512.4 million. Concurrently, the Coinbase Premium Index exhibits an upward trend, reflecting strengthening sentiment among U.S. institutional accounts reacting to liquidity signals from the U.S. Treasury's expanded bond buyback operations. On-chain metrics further reinforce the structural strength of this advance: Santiment’s Network Realized Profit/Loss remains constrained while the Age Consumed metric shows minimal activity, confirming that long-term holders are withholding supply rather than liquidating into strength. Meanwhile, derivatives markets experienced intense short-side liquidation pressure, with
$265 million in short positions wiped out over 24 hours and a staggering
$1.69 billion in short liquidations recorded across the trailing three-day window. From a technical perspective, ETH holds a firm bullish bias above its core Exponential Moving Average (EMA) stack. Price action trades comfortably above the
20-day ($2,009.00),
50-day ($1,924.00),
100-day ($1,943.00), and
200-day ($2,130.00) EMAs, establishing a dense structural dynamic floor. However, momentum metrics indicate overextended near-term conditions. The daily Relative Strength Index (RSI-14) standing near
87.00 and the Stochastic Oscillator near
99.00 both sit deep within overbought territory, increasing the probability of a temporary mean-reversion pullback. To sustain the current impulse toward the
$2,750.00 and
$2,868.00 target zones, buyers must defend spot acceptance above the newly converted
$2,431.00 horizontal pivot.
Technical Trend Structure: The $2,172 "Demand Floor" and the $2,750 "Supply Citadel" The ETH/USD daily market geometry reflects an explosive upside breakout from an accumulation base, supported by dynamic EMA trendlines.
The $2,750.00 "Supply Citadel": The primary overhead objective for Ethereum bulls sits at
$2,750.00 (Major Horizontal Resistance & Mid-April High). A sustained breakout above this level opens a technical runway toward the secondary expansion target at
$2,868.00.
The $2,431.00 "Pivot Node": The immediate structural threshold is the
$2,431.00 resistance level. Converting this level into secondary demand confirms structural acceptance and mitigates near-term pullback risks.
The $2,172.00 "Support Floor": On the downside, primary dynamic support is anchored between
$2,130.00 and $2,172.00 (200-day EMA & Structural Cushion). A corrective breakdown below this floor exposes secondary horizontal support at
$1,961.00 and the
20-day EMA at $2,009.00.
Strategic Trading: Decision Nodes and Tactical Scenarios Navigating current ETH price action requires monitoring confirmed acceptance around key structural boundaries.
Signal Type Entry Trigger Primary Target (TP) Protective Stop (SL) Tactical Rationale Bullish Breakout Daily Close >
$2,500.00 $2,750.00 / $2,868.00 $2,380.00 Continuation play on ETF inflows, short squeeze momentum, and $2,431 clearance.
Bearish Rejection H4 Close <
$2,431.00 $2,172.00 / $2,009.00 $2,530.00 Fading overbought RSI/Stochastics for a mean-reversion move toward the 200-day EMA floor.
Key Tactical Milestones: Immediate Resistance: The
$2,500.00 – $2,750.00 region. A decisive extension past this zone confirms buyer dominance and opens the path toward major target zones.
Critical Support: The
$2,431.00 horizontal pivot and the
$2,172.00 dynamic floor. Holding price action above these support levels preserves the broader bullish setup. In summary, Ethereum is trading with strong bullish momentum near
$2,500.00. With institutional ETF inflows accelerating and technical indicators signaling sustained buyer interest despite overbought readings, the technical structure favors an eventual test of
$2,750.00, provided the
$2,431.00 demand floor remains defended.
*The market analysis posted here is meant to increase your awareness, but not to give instructions to make a trade
 Italiano
 Русский
 English
 Bahasa Indonesia
 Bahasa Malay
 ไทย
ไทย Español
 Deutsch
 Български
 Français
 Tiếng Việt
 中文
中文 বাংলা
বাংলা हिन्दी
 Čeština
 Українська
 Română
