 Ethereum Derivatives Leverage Flush Ignites Rally: ETH Eyes $2,431 Resistance amid Surge in Institutional ETF Inflows
 The
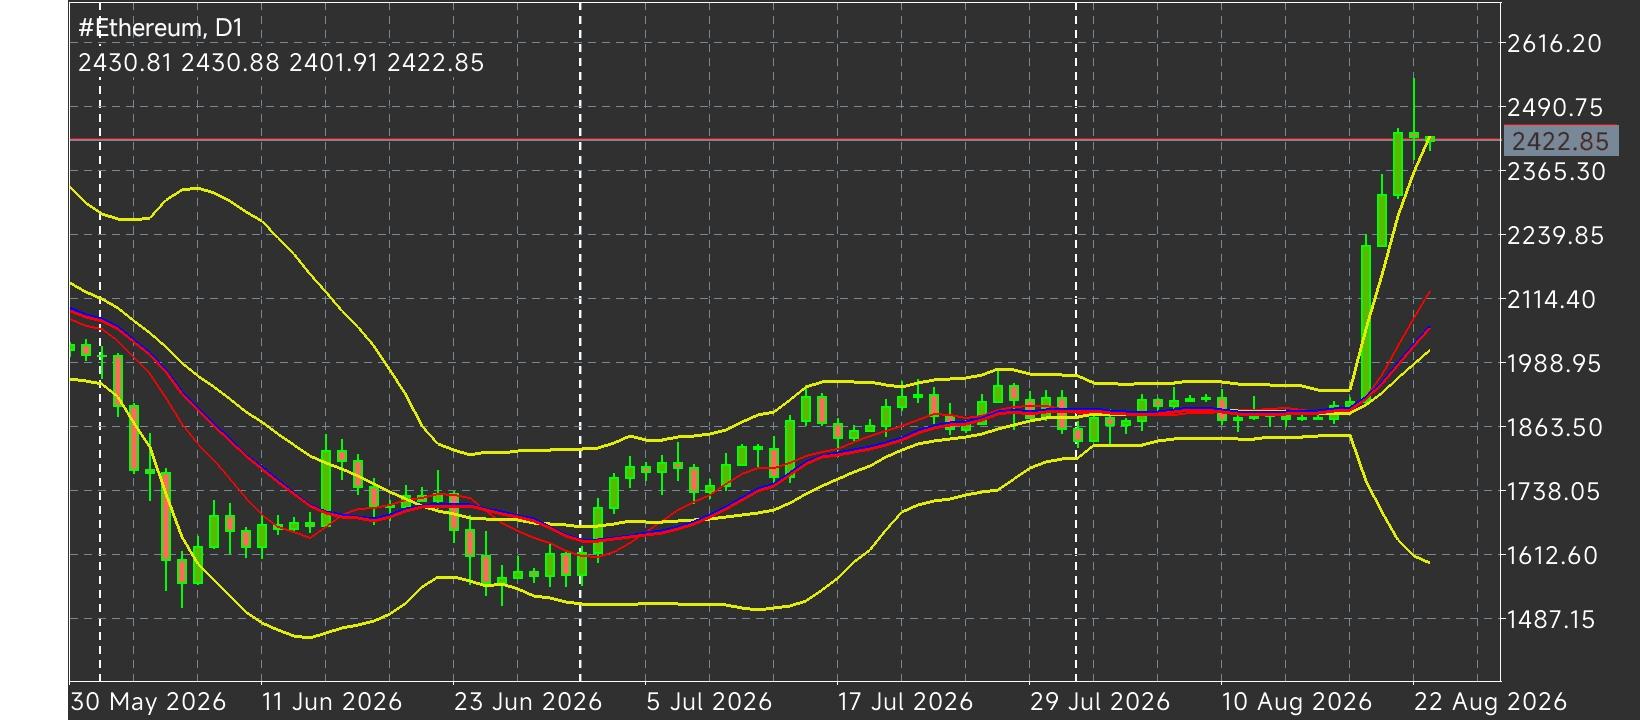
Ethereum (ETH/USD) daily chart demonstrates a strong bullish breakout during Thursday's trading session, driven by a sharp rebound in derivatives leverage following a massive market-wide wipeout. Outstanding contract value in the derivatives market surged by 270K ETH to reach 13.2 million ETH, while annualized funding rates spiked to 0.011%—the highest level recorded since late May—confirming that aggressive long positioning is returning to drive upside continuation. This leverage expansion comes on the heels of Wednesday's record-setting derivatives wipeout, which saw approximately $3 billion in short positions liquidated across crypto venues, with Ethereum accounting for nearly 40% of the total destruction. Although on-chain data from Lookonchain indicates select whale wallets (including 0x004e and 0x2E88) have begun initiating tactical short hedges totaling over 29.3K ETH, broader institutional order flow remains heavily supportive. US spot Ethereum ETFs recorded a massive $189.1 million net inflow on Wednesday—the largest single-day institutional intake since last October—complemented by substantial whale exchange withdrawals from wallets such as 0x2d59 and Abraxas Capital.
Multi-Month Base & Leverage Wipeout: Prior to the current rally, Ethereum established a prolonged accumulation base anchored around its multi-month structural lows at
$1,507.00,
$1,701.00, and
$1,809.00. The recent $3 billion short squeeze flushed out systemic leverage, temporarily dropping open interest to a low of 12.93 million ETH before fresh institutional spot accumulation absorbed the liquidations and ignited a 20% multi-day price expansion.
The Impulsive Breakout & Moving Average Convergence: An aggressive buying wave propelled ETH through key technical hurdles, reclaiming the 20-day Exponential Moving Average (EMA) at
$1,902.00, the 100-day EMA at
$1,932.00, and the 50-day EMA at
$1,961.00. The continuation carried price decisively above the major 200-day EMA at
$2,177.00, while overbought momentum indicators—with the 14-day Relative Strength Index (RSI) at 84.00 and the Stochastic Oscillator at 92.00—signal extreme buying intensity that may precede a brief high-level consolidation.
Whale Distribution vs. Institutional Absorption: Exchange Inflow metrics reveal clear profit-taking spikes as early buyers transfer tokens to centralized venues following the 20% surge. However, these distribution attempts are being actively countered by surging Exchange Outflows and robust spot ETF inflows ($189.1M), creating a tight high-level consolidation directly beneath major horizontal resistance. From a structural perspective, key technical levels and operational target zones are mapped as follows:
Overhead Resistance Targets: The primary technical hurdle is located at the horizontal ceiling near
$2,431.00. A sustained breakout and daily close above
$2,431.00 would invalidate local whale short positions and clear the path for a broader macro extension toward
$2,650.00 and
$2,850.00.
Key Support Boundaries: Immediate dynamic support rests at the 200-day EMA and confluent horizontal level at
$2,172.00–$2,177.00. Secondary structural support aligns at the 20-day EMA and horizontal floor near
$1,961.00, followed by the 100-day EMA at
$1,932.00 and 50-day EMA at
$1,902.00, with deeper macro floors anchored at
$1,809.00,
$1,701.00, and
$1,507.00. The broader trend structure for Ethereum retains a strong bullish posture across daily and weekly horizons. The sequence of higher highs and higher lows remains firmly intact as long as price holds above the
$2,172.00 200-day EMA support cluster. Supported by record spot ETF inflows and expanding derivatives open interest, the path of least resistance points toward a retest of the
$2,431.00 resistance ceiling, with minor pullbacks expected to find eager buyer demand.
*The market analysis posted here is meant to increase your awareness, but not to give instructions to make a trade
 Italiano
 Русский
 English
 Bahasa Indonesia
 Bahasa Malay
 ไทย
ไทย Español
 Deutsch
 Български
 Français
 Tiếng Việt
 中文
中文 বাংলা
বাংলা हिन्दी
 Čeština
 Українська
 Română
