 Fundamental Analysis
 The EUR/USD pair remains within a positive technical picture, despite remaining above the 61.8% Fibonacci retracement of the April to June fall. The pair is beginning to indicate increased bullish pressure. As traders trying to push prices above the key technical level of the 200-day Simple Moving Average. Such a breakout from this important technical level will mean that bullish pressure is gaining momentum. EUR/USD struggles to build on Tuesday's minor recovery from its weekly lows and continues to trade with a negative bias early in the European session on Wednesday. Spot rates, however, continue to trade above the 1.1600s region and remain near their best levels since May 14, amid expectations for further clues on the US Federal Reserve's (Fed) interest rate policy. This being the case, all eyes will be on the release of the US PCE Price Index data due today and the Fed Chairman's speech at the Jackson Hole symposium on Friday. The Fed's policy stance will highly influence USD price action in the short term. In the meantime, a positive fundamentals environment will help traders refrain from initiating any short positions in the EUR/USD pair.
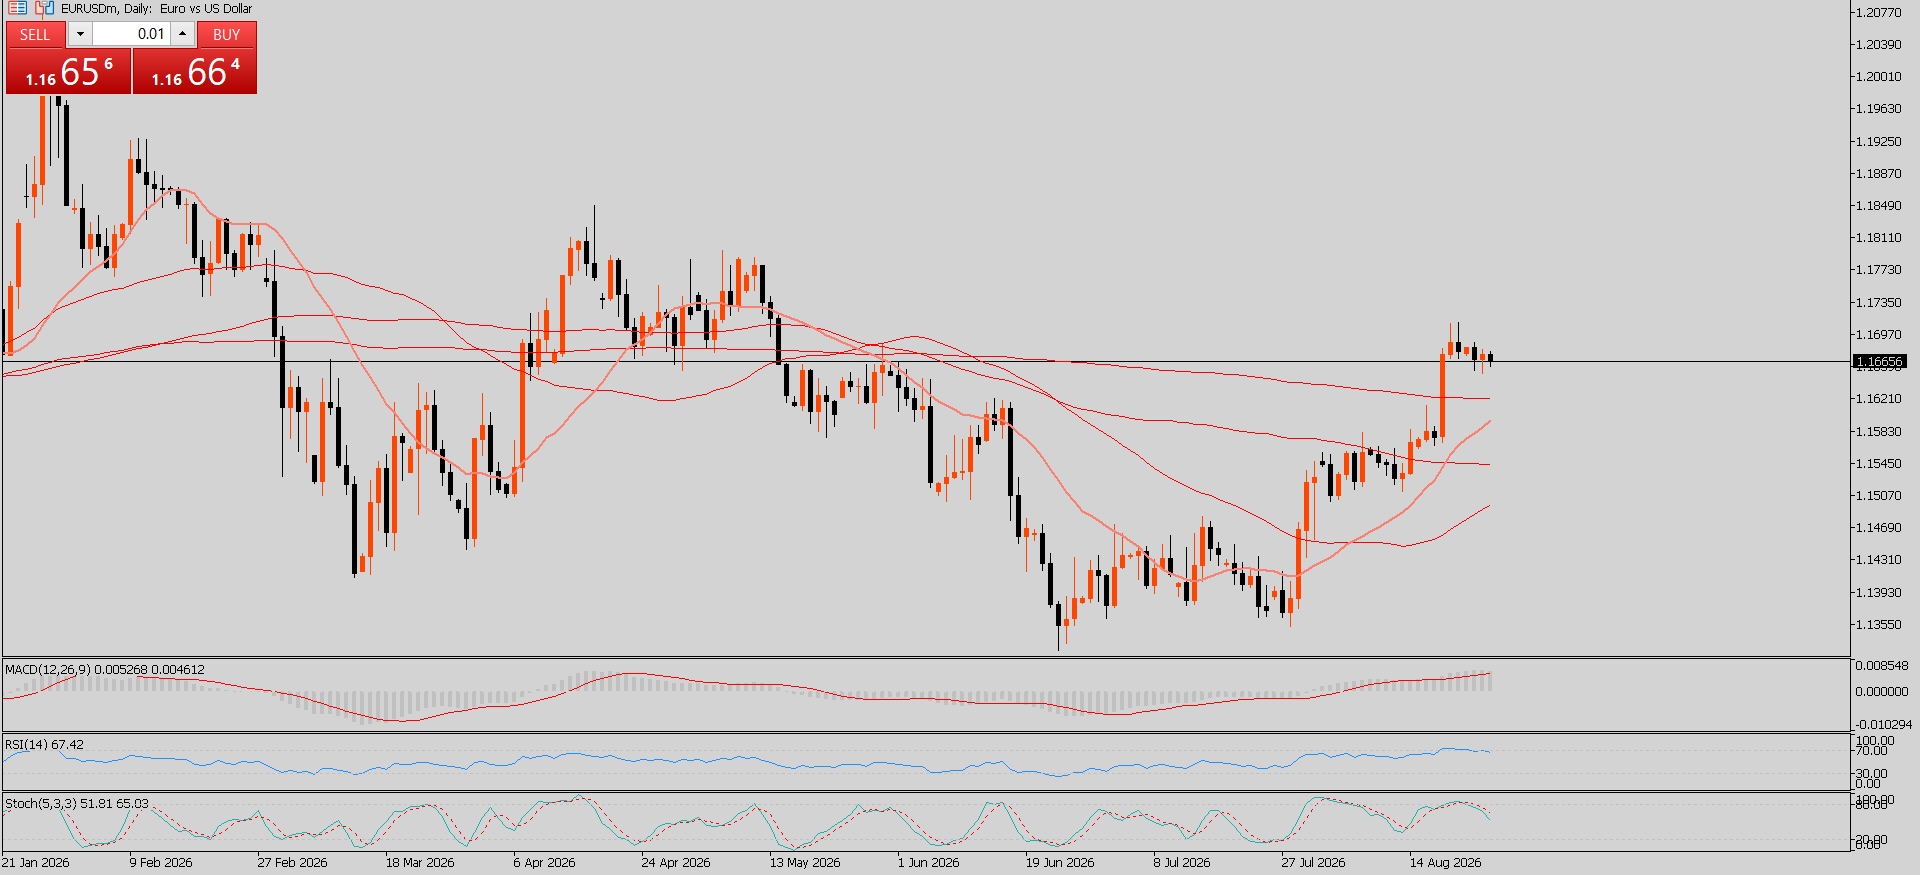
Technical Analysis The EUR/USD pair remains within a positive technical picture, despite remaining above the 61.8% Fibonacci retracement of the April to June fall. The pair is starting to indicate increased bullish pressure as traders try to drive prices above the important technical level of the 200-day Simple Moving Average. Such a breakout from this important technical level will mean that bullish pressure is gaining momentum. For the moment, the emphasis on the chart is on 1.1738, a level that represents the 78.6% Fibonacci retracement of the previous drop in April-June. This area may become the next resistance because it is near the top of the recent rebound. A daily close above 1.1738, with trading above this level, may spark buyer interest and push the pair toward the cycle high at 1.1852. A move above 1.1852 will confirm the overall bullish pattern. However, regarding the negative factors, the first major level of support is in the range of 1.1649 to 1.1632. This level is significant because it marks the 61.8% Fibonacci retracement and the 200-day simple moving average. Maintaining price action above this confluence of levels means the present bullish bias remains intact and that buyers are absorbing pullbacks. In the event of stronger selling pressure, a break of the 1.1632 support level will be observed, and the 50% Fibonacci retracement at 1.1586 will become the target price. In case of the break of this level, the 38.2% Fibonacci retracement at 1.1523 will come into play. All these levels will mark deeper retracements, but not a reversal of the current trend, unless the price makes sustained closes below them. From a technical perspective, EUR/USD still has a positive bias as long as it remains above the confluence area of 1.1649/1.1632. The Fibonacci setup is also bullish, with 1.1738 as the breakout level and 1.1852 as the main target price.
*The market analysis posted here is meant to increase your awareness, but not to give instructions to make a trade
 Italiano
 Русский
 English
 Bahasa Indonesia
 Bahasa Malay
 ไทย
ไทย Español
 Deutsch
 Български
 Français
 Tiếng Việt
 中文
中文 বাংলা
বাংলা हिन्दी
 Čeština
 Українська
 Română
