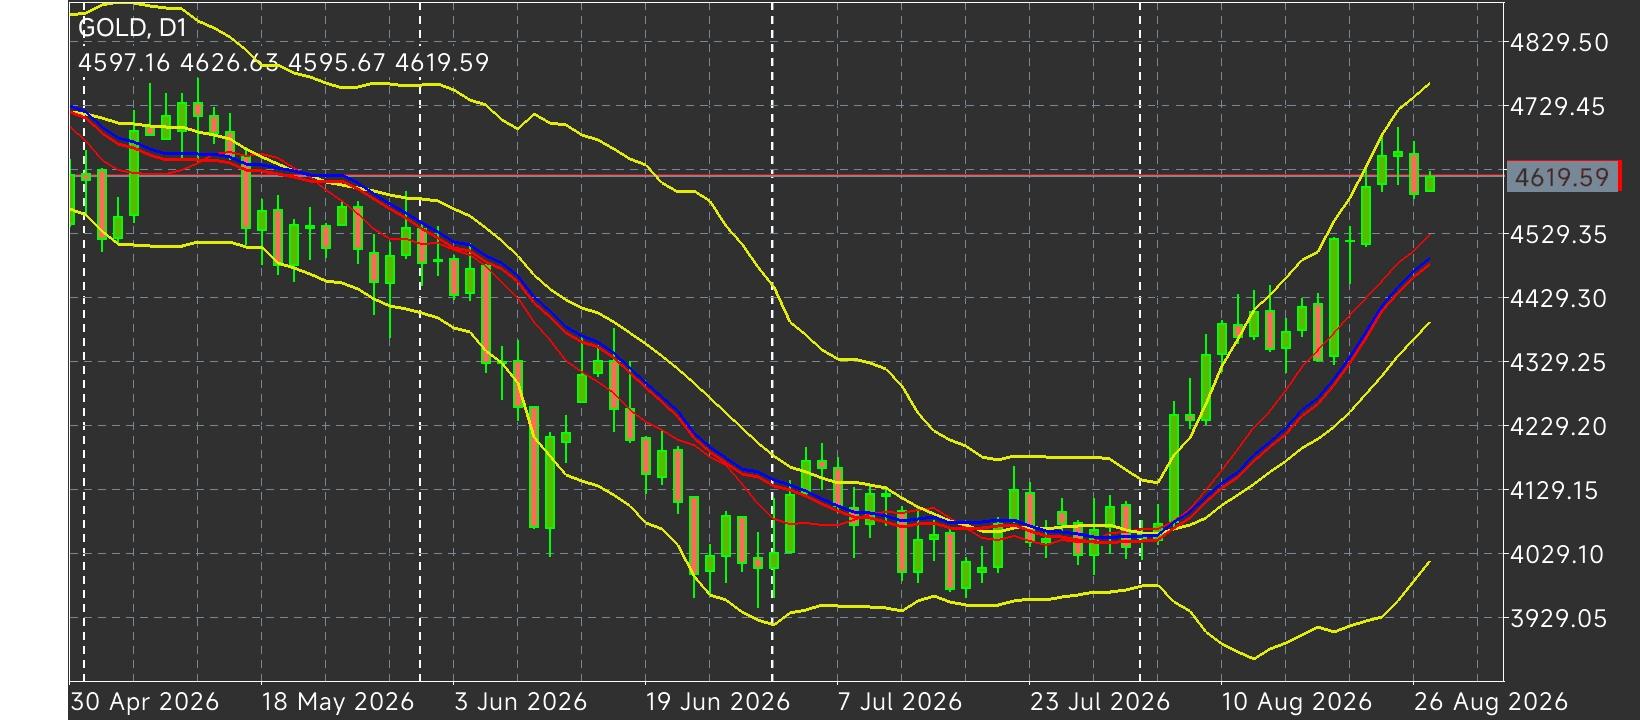
 Bullion Retraces Toward $4,610 Floor Post-PCE Print: XAU/USD Refuses to Capitulate Ahead of Jackson Hole Catalyst
 The
XAU/USD (Gold) spot rate retreated toward
$4,610.00 during Thursday's early Asian session, pulling back from recent multi-month highs as markets digested fresh US inflation metrics. Data from the US Bureau of Economic Analysis revealed that July's headline Personal Consumption Expenditures (PCE) Price Index held steady at 3.7% year-over-year—slightly hotter than the 3.6% forecast—while the core PCE rate met expectations at 3.3% YoY. Both metrics posted 0.2% monthly gains. The firmer inflation reading nudged expectations for a 25 basis point Federal Reserve interest-rate hike in September to nearly 38% according to the CME FedWatch tool, sparking brief profit-taking across precious metals. Nevertheless, senior metals strategists noted that gold's reaction was primarily a high-level consolidation within the prior session's range rather than structural weakness. Furthermore, market commentators at Rabobank emphasized that despite a pronounced short squeeze in long-dated US Treasuries driven by expanded US Treasury buyback programs, gold has shown no signs of outright capitulation, highlighting the persistent underlying bid supporting non-yielding bullion ahead of Federal Reserve Chair Kevin Warsh's scheduled address at the Jackson Hole Symposium.
Macro Inflation & Fixed-Income Dynamics: A hotter headline PCE print of 3.7% YoY reinforced sticky inflation concerns, boosting Federal Reserve rate hike odds for September. However, expanding Treasury buyback operations and broader sovereign debt hedging continue to insulate gold from aggressive selling pressure.
High-Level Consolidation Below Multi-Month Highs: Market participants interpret the dip from
$4,670.00 to
$4,610.00 as healthy profit-taking rather than trend exhaustion. Gold continues to trade within the upper half of its daily volatility bands, retaining structural control despite interim policy headwinds.
RSI Expansion & Dynamic Cushioning: Momentum remains firm with the 14-day Relative Strength Index (RSI) hovering at 67.64—just below overbought territory. This indicates strong buying pressure that is stretching higher while remaining anchored by rising daily moving averages. From an execution and chart structure perspective, key technical levels and target zones are mapped as follows:
Overhead Resistance Targets: Immediate horizontal resistance is anchored at the 20-day upper Bollinger Band near
$4,745.00. A confirmed daily close above this boundary would signal an extension of the macro bull run toward multi-year psychological expansion targets.
Key Support Boundaries: Primary downside protection rests at the rising 100-day Simple Moving Average (SMA) around
$4,380.00, tightly coupled with the 20-day middle Bollinger Band at
$4,365.00 to form a dense structural demand cluster. A deeper, secondary floor is marked by the lower Bollinger Band at
$3,985.14. The broader technical trend structure for XAU/USD remains decisively bullish across daily timeframes. As long as spot prices hold above the
$4,365.00–$4,380.00 dynamic support zone, the path of least resistance points toward an eventual retest of
$4,745.00, with interim pullbacks offering responsive accumulation opportunities ahead of Jackson Hole event risk.
*The market analysis posted here is meant to increase your awareness, but not to give instructions to make a trade
 Italiano
 Русский
 English
 Bahasa Indonesia
 Bahasa Malay
 ไทย
ไทย Español
 Deutsch
 Български
 Français
 Tiếng Việt
 中文
中文 বাংলা
বাংলা हिन्दी
 Čeština
 Українська
 Română
