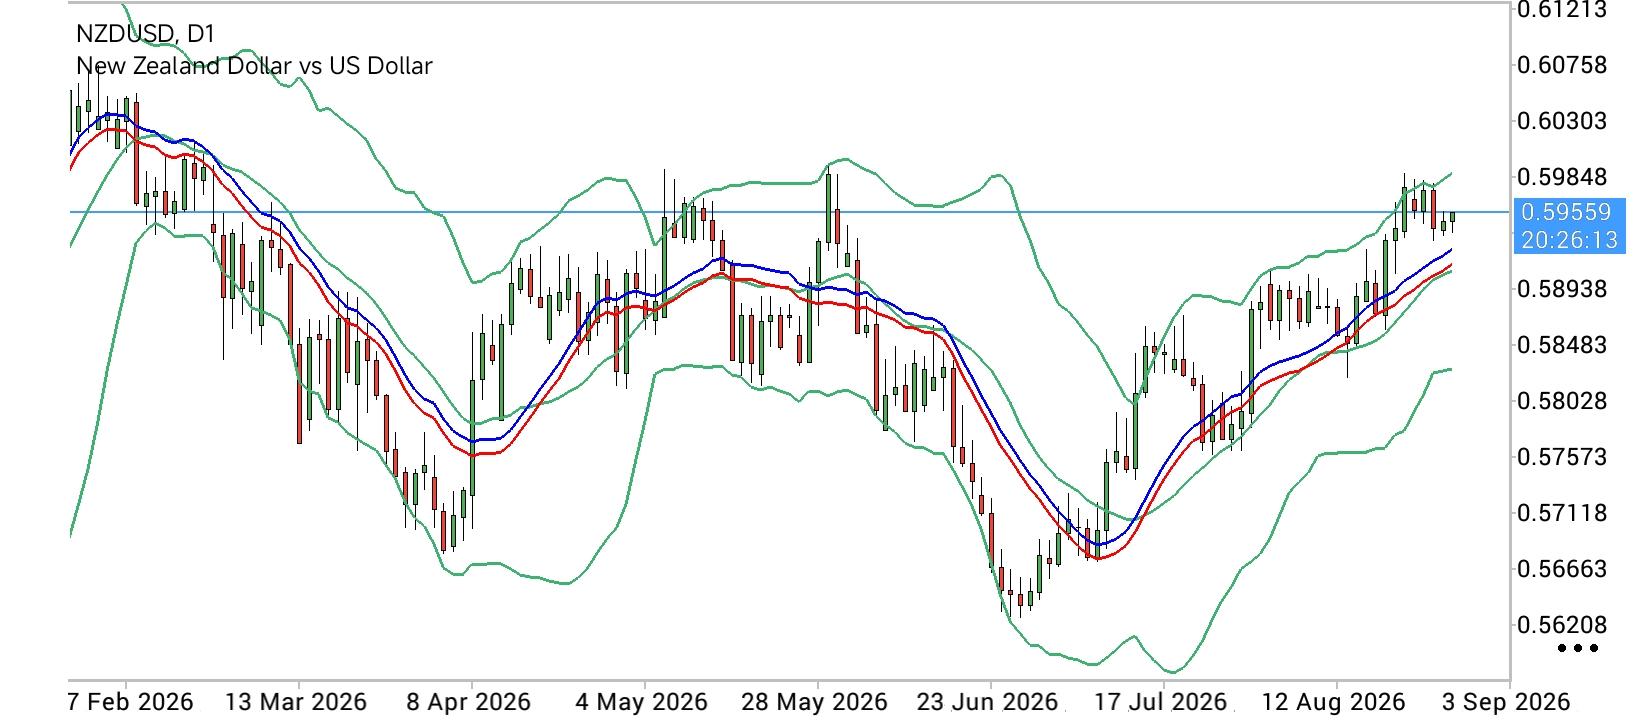
 The "0.6000 Supply Citadel": Sticky US PCE Inflation and Fed Hike Fears Push NZD/USD Toward Weekly Range Lows
 The
New Zealand Dollar (NZD) extended its decline for a second consecutive session against a resurgent U.S. Dollar (USD) on Monday, as sticky U.S. inflation data reinforced expectations of sustained hawkish pressure on the Federal Reserve (Fed).
NZD/USD bears are targeting the lower boundary of the weekly range near
0.5930, following a firm technical rejection just shy of the
0.6000 psychological resistance handle earlier in the week. The U.S. Personal Consumption Expenditures (PCE) Price Index released on Wednesday confirmed that underlying inflationary pressures remain well above the Fed's 2% target. Although market bets for a rate hike at the upcoming September 16 Federal Open Market Committee (FOMC) meeting remain largely unchanged according to the CME FedWatch Tool, sticky inflation keeps the debate alive over whether interest rates will be lifted further or held steady before year-end. Despite short-term strength in the Greenback, market sentiment remains finely balanced. Strategists at ING noted that while they remain "reasonably confident in call for the Fed to hold on 16 September and, by extension, in a weaker Dollar," they cautioned that "the next three weeks may need to bring a more convincing combination of data and Fedspeak before markets move closer to a hold outcome." This highlights the critical role incoming U.S. economic indicators and central bank communication will play in dictating U.S. Dollar price dynamics. From a technical perspective, NZD/USD maintains an underlying bullish bias on the daily timeframe, holding firm above an ascending trendline originating from late June lows near
0.5900, as well as the 200-day Simple Moving Average (SMA) at
0.5844. Momentum indicators reflect this constructive setup, with the
Relative Strength Index (RSI) hovering near
60 and a positive Moving Average Convergence Divergence (MACD) histogram signaling that buyers retain control despite temporary intraday momentum loss.
Technical Trend Structure: The 0.5900 "Demand Floor" and the 0.6000 "Supply Citadel" The daily NZD/USD chart geometry displays a constructive bullish baseline, with price action respecting an ascending multi-month support line while capped by multi-month horizontal ceiling barriers.
The 0.6000 "Supply Citadel": The primary overhead technical resistance cluster sits between
0.6000 (psychological handle and May/June swing highs) and
0.6054 (February 18 high). A broader resistance layer extends higher toward the Year-to-Date (YTD) high region at
0.6100.
The 0.5930 "Pivot Node": The immediate structural line in the sand is defined by the weekly range low at
0.5930. A daily candle close back above this baseline is required to neutralize immediate intraday selling pressure.
The 0.5900 "Support Floor": On the downside, primary structural support resides at the ascending trendline support near
0.5900. A decisive breakdown below this support boundary exposes secondary dynamic targets at
0.5844 (200-day SMA) and the broader structural floor near
0.5780.
Strategic Trading: Decision Nodes and Tactical Scenarios Navigating NZD/USD daily price action requires monitoring confirmed daily closes relative to primary trendline boundaries and static moving average hurdles.
Signal Type Entry Trigger Primary Target (TP) Protective Stop (SL) Tactical Rationale Bullish Rebound H4 Bullish Rejection >
0.5900 0.6000 / 0.6054 0.5865 Buying the dip at the ascending trendline support node, aligned with RSI ~60 momentum.
Bearish Breakdown Daily Close <
0.5900 0.5844 / 0.5780 0.5945 Trendline breakdown play targeting the 200-day SMA floor following persistent Fed rate hike fears.
Key Tactical Milestones: Immediate Resistance: The
0.6000 psychological barrier and May/June peak zone. Reclaiming this region is necessary to open a runway toward
0.6054 and
0.6100.
Critical Support: The
0.5900 ascending trendline and
0.5844 200-day SMA. Maintaining price action above this baseline preserves the broader bullish trend structure. In summary, NZD/USD is trading with a near-term consolidated bias around
0.5944. Supported by the ascending trendline near
0.5900 and a healthy RSI reading of
60, technical indicators favor an eventual retest of
0.6000, provided the
0.5900 trendline support barrier remains intact.
*The market analysis posted here is meant to increase your awareness, but not to give instructions to make a trade
 Italiano
 Русский
 English
 Bahasa Indonesia
 Bahasa Malay
 ไทย
ไทย Español
 Deutsch
 Български
 Français
 Tiếng Việt
 中文
中文 বাংলা
বাংলা हिन्दी
 Čeština
 Українська
 Română
