 Gold Under Siege: XAU/USD Tumbles to Two-Week Lows Near $4,330 as Surging Yields and Hawkish Fed Pressure Bullion
 The
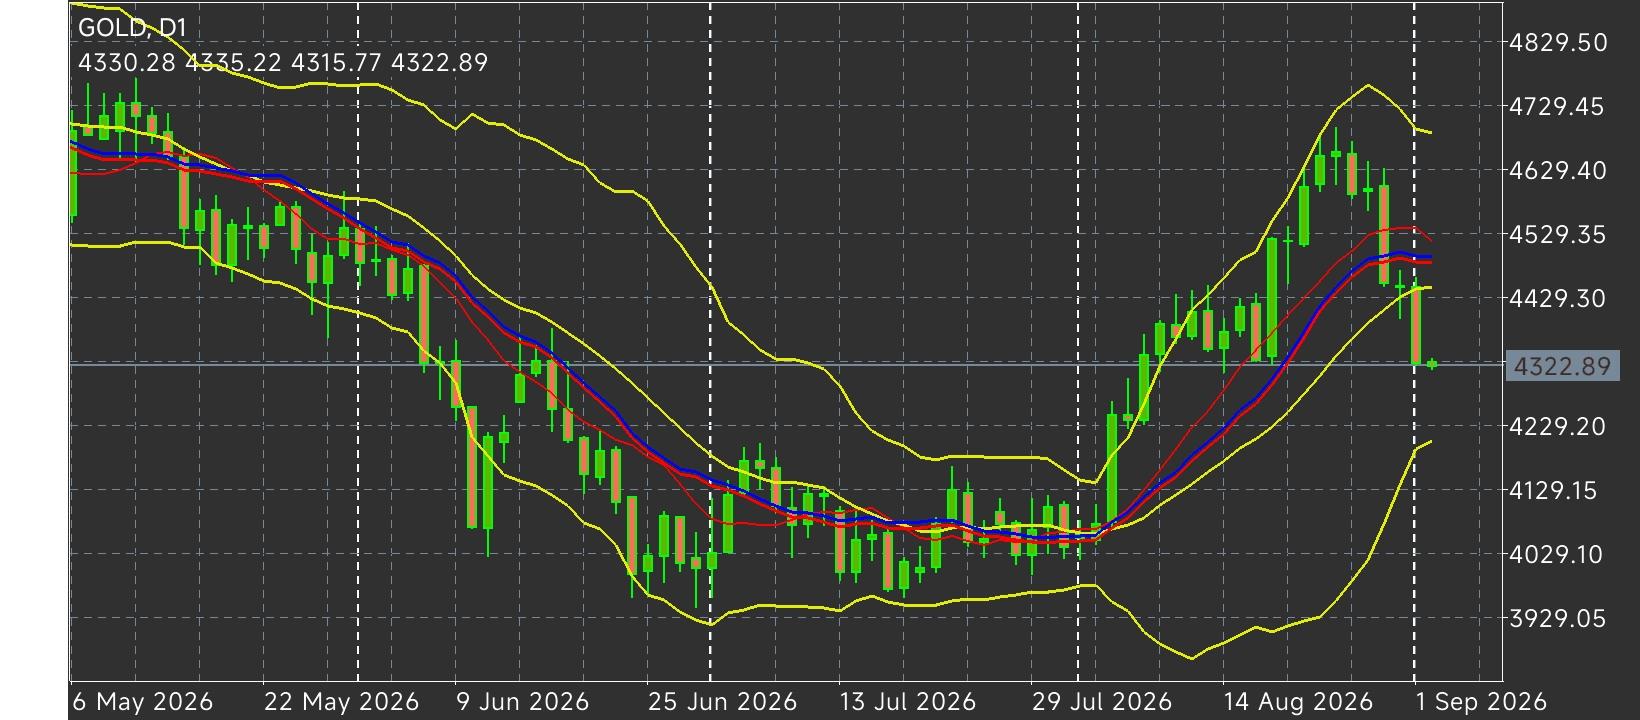
XAU/USD (Gold) daily chart demonstrates a clear short-term bearish acceleration, with price action tumbling toward the
$4,330.00 region during early Asian session trading on Wednesday. The precious metal is facing sharp selling pressure driven by a surging US Dollar and benchmark US Treasury yields climbing to their highest levels since January 2025. This global bond selloff has been catalyzed by escalating military conflict in the Middle East—highlighted by direct strikes between US and Iranian forces around the Strait of Hormuz—which has stoked global energy-driven inflation fears. Coupled with hawkish commentary from Federal Reserve Chair Kevin Warsh at Jackson Hole warning of potential interest rate hikes if inflation remains sticky, rising yields have significantly increased the opportunity cost of holding non-yielding bullion, overshadowing traditional safe-haven demand.
The Distribution & Upper Resistance Phase: Prior to the current decline, Gold attempted to sustain higher levels but ultimately faced strong institutional distribution near the upper Bollinger Band. As momentum stalled, sellers absorbed buying attempts, creating a prominent swing high and driving price action back down toward core moving average baselines. The persistent inability of buyers to generate a high-volume breakout above overhead resistance set the stage for a broader corrective phase.
The Dynamic Breakdown & Trend Acceleration: On the daily timeframe, a strong high-volume downward impulse forced price beneath both the 100-day Simple Moving Average (SMA) at
$4,365.00 and the 20-day middle Bollinger Band near
$4,445.00. Sinking below these overlapping dynamic barriers confirmed that short-term market structure has shifted in favor of the bears, turning former dynamic support into firm resistance overhead. The 14-period Relative Strength Index (RSI) dropped to 46.28, slipping below its neutral 50 midpoint and reflecting steady downside momentum that has yet to show signs of exhaustion or oversold conditions.
Low-Level Coiling & Support Retest: At current levels near
$4,330.00, price action is testing multi-week lows as traders digest hawkish Fed rhetoric and position ahead of Friday’s US August Nonfarm Payrolls report. While TD Securities notes that overall long positioning in Gold has shown structural resilience despite rate hike fears, spot price remains trapped below key daily averages, coiling tightly near intermediate support as the market awaits fresh labor market catalysts. From a price level perspective, the technical architecture is clearly defined across key horizontal and dynamic zones:
Overhead Resistance Targets: The immediate dynamic hurdle aligns with the 100-day SMA at
$4,365.00. Above this level, stronger secondary resistance sits at the 20-day middle Bollinger Band near
$4,445.00, while a broader bullish reversal would be required to target the upper Bollinger Band at
$4,695.00.
Key Support Boundaries: To the downside, primary structural support sits at the lower Bollinger Band around
$4,192.00. A decisive daily close beneath $4,192.00 would confirm a deeper corrective breakdown and open the door toward lower psychological support floors. The overall trend structure for XAU/USD remains capped and short-term bearish on the daily chart. Price action continues to hold beneath both the 100-day SMA ($4,365.00) and the 20-day middle Bollinger Band ($4,445.00), maintaining a pattern of lower highs and lower lows off the recent peak. With the RSI at 46.28 favoring sellers, the path of least resistance remains directed toward
$4,192.00, while a daily close back above
$4,365.00 would be required to neutralize the immediate selling pressure.
*The market analysis posted here is meant to increase your awareness, but not to give instructions to make a trade
 Italiano
 Русский
 English
 Bahasa Indonesia
 Bahasa Malay
 ไทย
ไทย Español
 Deutsch
 Български
 Français
 Tiếng Việt
 中文
中文 বাংলা
বাংলা हिन्दी
 Čeština
 Українська
 Română
