 Fundamental Analysis
 Silver (XAG/USD) bounces back on Wednesday to trade at $65.10 at the time of writing, adding 0.32% in the session after erasing early losses. Silver gained a little support from weaker-than-expected economic numbers in the United States (US), despite higher US Treasury yields and the likelihood of tighter monetary policy from the Fed. The latest employment numbers offer some relief to silver. ADP Employment Change reveals that the US economy created only 38K jobs in August, below expectations of 47K and down from an increase of 46K the previous month. Nonetheless, expectations for the Fed's actions remain quite hawkish. According to the CME FedWatch tool, there is approximately a 64% probability that the bank will raise interest rates at the upcoming September 15-16 meeting, up from 36% just a week ago. Higher rate expectations have been exerting upward pressure on US Treasury yields, thereby posing a strong headwind for silver, a non-yielding asset. The yield on the benchmark 10-year US Treasury rose to 4.81% on Wednesday, marking its highest level since 2023, before easing slightly. Furthermore, rising tensions in the Middle East have driven higher oil prices, adding yet another risk factor to the inflation forecast. Thus, ongoing energy-related price pressures might prompt the Fed to continue its policy. The prospect of higher interest rates also underpins the USD, but weak employment numbers are preventing the Greenback from advancing with greater conviction. In such an environment, it becomes clear that the rally in silver is being held back by weakness in US labour markets and the prospect of tightening measures by the Fed. Now all eyes will be on the NFP figures on Friday.
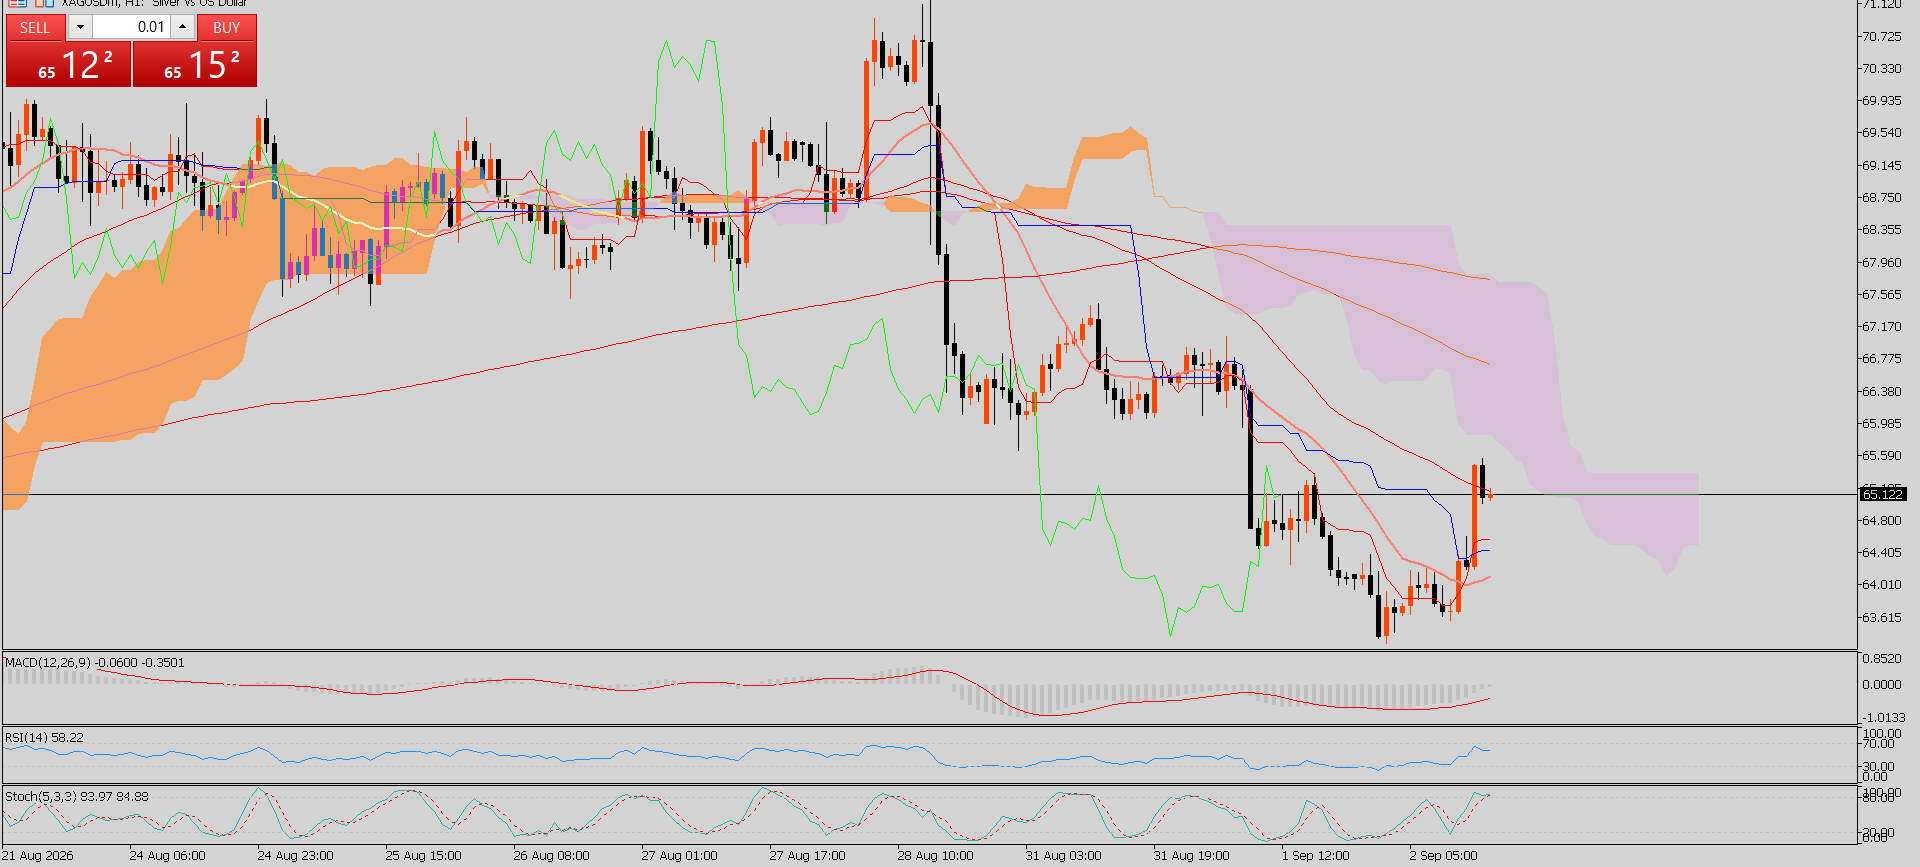
Technical Analysis The XAG/USD currency pair is currently trading at $65.10 on the hourly chart and retains its negative short-term bias, as price remains below both the 100-hour Simple Moving Average at $66.81 and the 200-hour SMA at $67.80. These are some important levels trading above the current price, indicating that the current recovery attempt is not a bullish reversal but a corrective move. While prices remain trading below this cluster of moving averages, selling pressure may continue to mount. Some signs of stabilising momentum have emerged, with RSI trading around 48.75. The indicator is just below the neutral level of 50, suggesting that bearish momentum has moderated slightly, but sellers still hold an edge. However, there is no risk of RSI moving into an oversold condition, which would allow for further declines in the event of new selling activity in the market. Only the recovery of the indicator above 50 will be the first signal of the resumption of buying momentum. As for upside potential, the nearest resistance zone is at $66.70-$66.81. The 100-hour SMA marks this level. The $67.50 level is the next hurdle for bulls. 200-hour SMA at $67.80 represents the final obstacle for the ascending price. Bulls should conquer this entire resistance cluster to undermine the bearish scenario. The next upside target will be set at $71.12. However, on the downside, the $63.32 level is the first significant support, followed by $62.19 and $60.87. Breaking above $63.32 will strengthen bearish pressure and push prices lower toward further support levels. In general, the technical outlook is still bearish as long as silver is trading below key hourly moving averages and the XAG/USD pair.
*The market analysis posted here is meant to increase your awareness, but not to give instructions to make a trade
 Italiano
 Русский
 English
 Bahasa Indonesia
 Bahasa Malay
 ไทย
ไทย Español
 Deutsch
 Български
 Français
 Tiếng Việt
 中文
中文 বাংলা
বাংলা हिन्दी
 Čeština
 Українська
 Română
