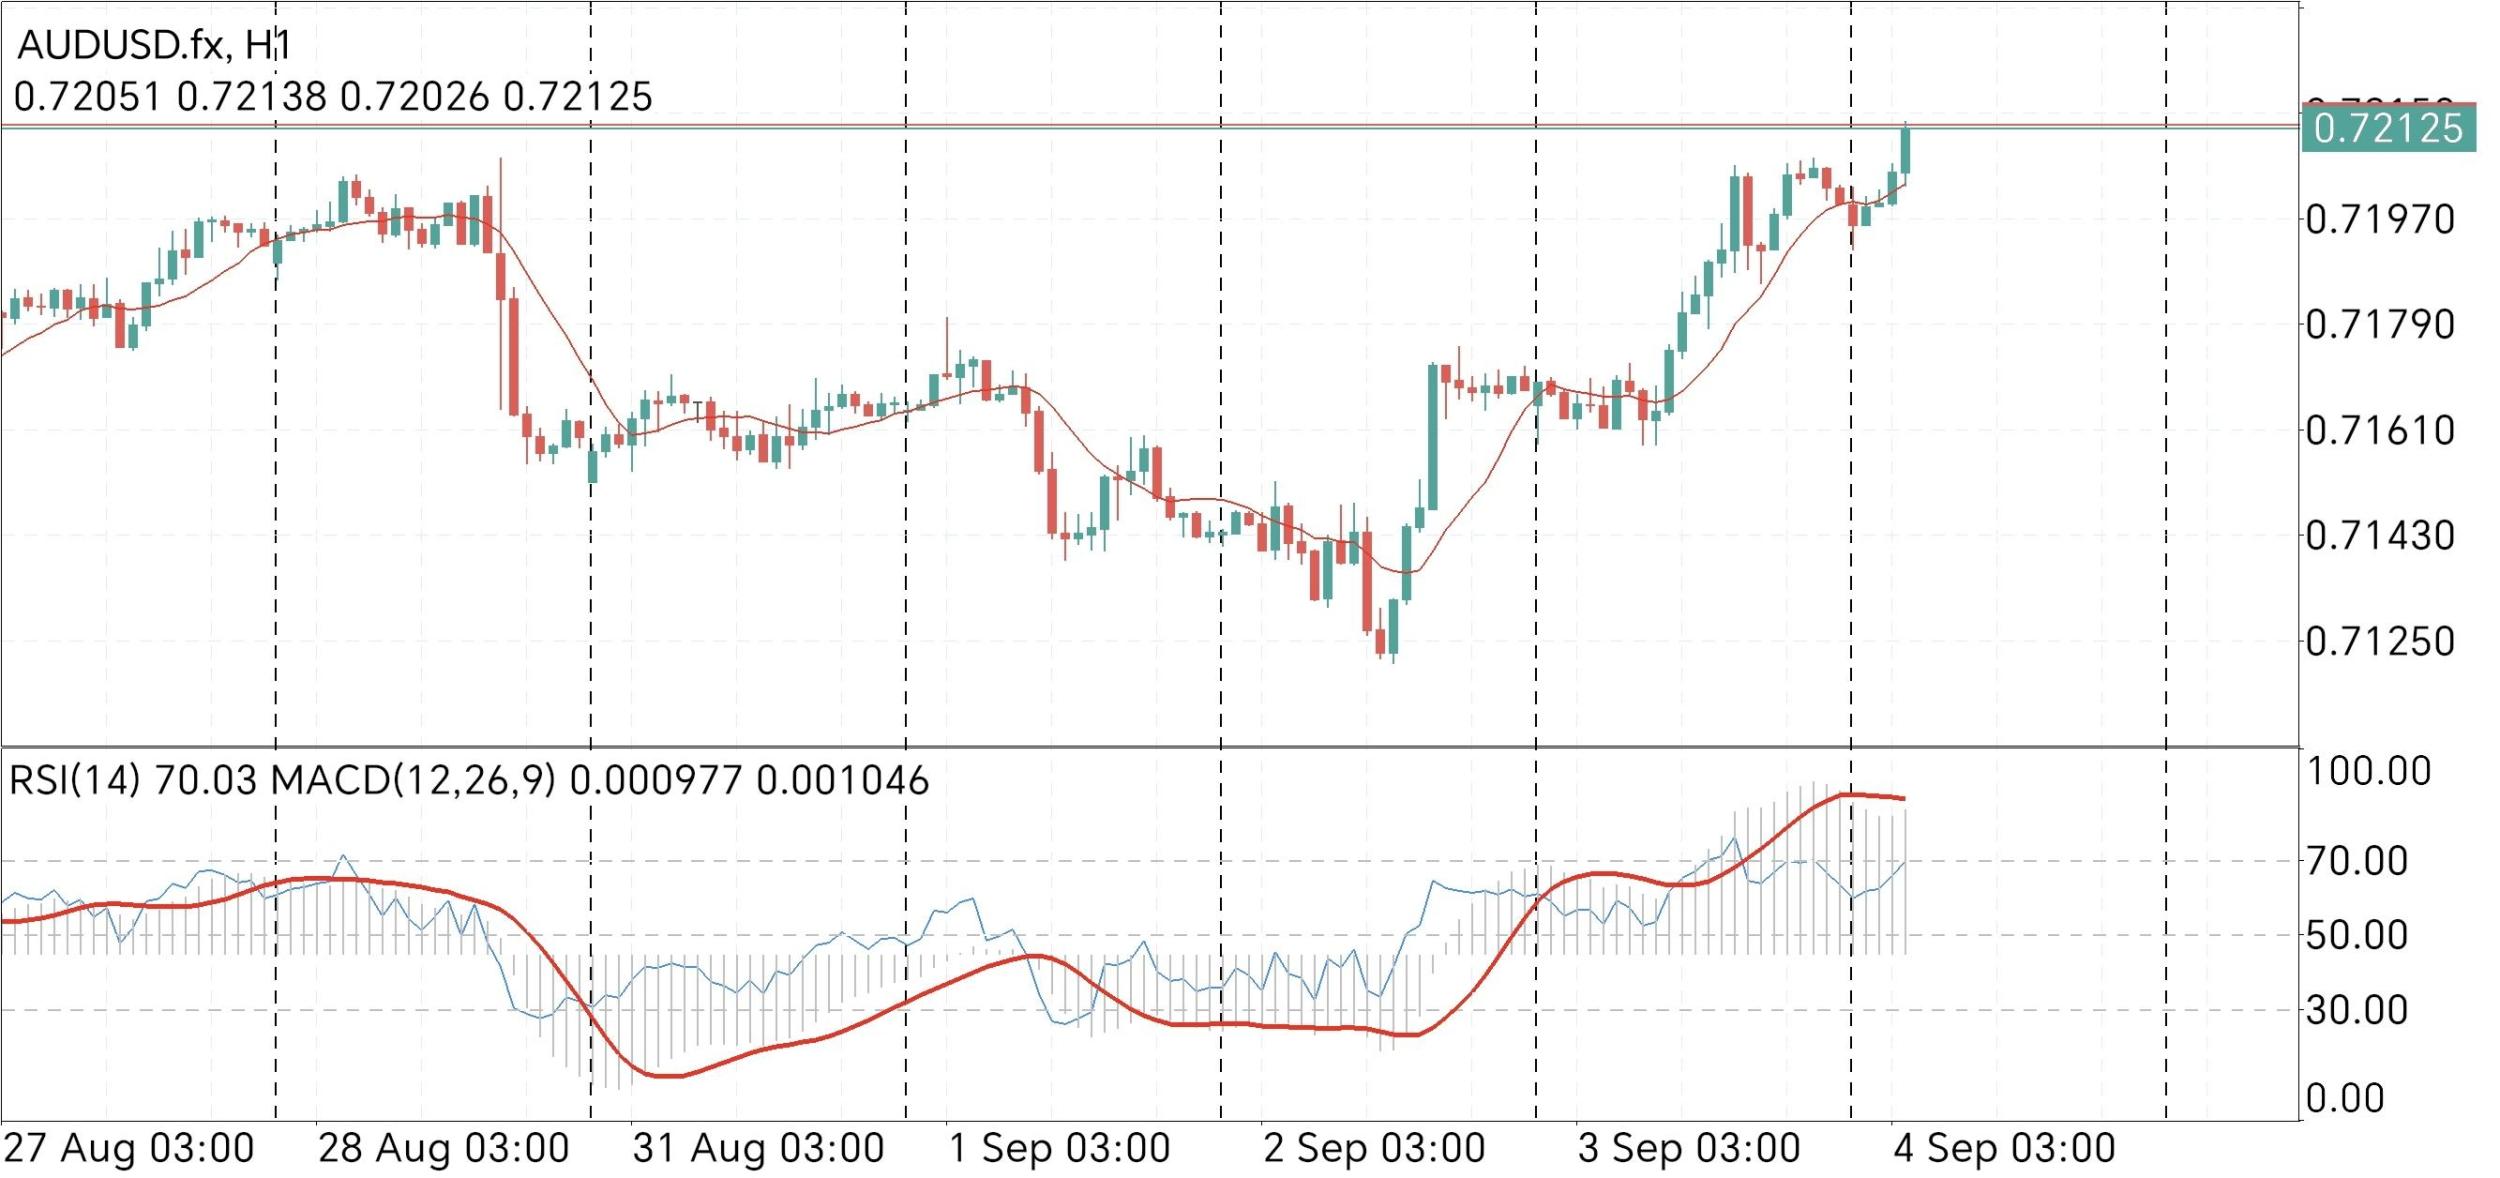
 Primary Trend and Key Levels
 On the H1 AUDUSD chart, price is trading near 0.72125 after a clear bullish impulse from the 0.71250 zone (early September). However, the latest candle shows rejection at 0.72138, with RSI(14) at 70.03—overbought—and MACD histogram losing momentum (0.000977 vs signal 0.001046), suggesting waning buying pressure. The primary trend is bullish on the shorter horizon (higher highs since 28 Aug), but we are approaching a critical resistance zone. Nearest major resistance is 0.72138–0.72150 (current session high and a previous minor swing high from 27 Aug). Immediate support lies at 0.71970 (yesterday’s close and a pivot low), with stronger support at 0.71610 (31 Aug low) and 0.71430 (the breakout level from 2 Sep). A visible rising wedge is forming, with converging trendlines connecting the higher lows and higher highs since 31 Aug—this is a classic reversal pattern when occurring after a strong rally, especially with bearish RSI divergence (price made higher high but RSI failed to exceed its prior peak near 72).
Market Structure and Pattern Recognition The structure shows a series of impulsive up-moves followed by shallow pullbacks, typical of a corrective phase within a larger downtrend on daily/timeframes. The wedge’s apex is approaching, and today’s rejection at 0.72138, combined with overbought RSI, increases the probability of a bearish break below the lower wedge boundary (currently ~0.71900). No clear double top or head-and-shoulders is yet completed, but the wedge plus a potential bearish engulfing or shooting star on the current H1 candle would confirm a short-term reversal. The 0.72026 low (session low) acts as an immediate trigger—if broken, the wedge is invalidated to the downside. Conversely, a clean break above 0.72150 would negate the pattern and open the door to 0.72500 (next measured move target). The MACD’s bearish crossover is imminent, supporting the bearish scenario. Bullish Scenario If price holds above 0.71970 and breaks decisively above 0.72150 with strong volume and RSI re-entering overbought (above 75), the wedge resolves to the upside. Target: 0.72500 (1.618 Fibonacci extension of the 31 Aug–3 Sep rally). A bullish entry could be a buy stop above 0.72150, stop-loss below 0.71950, risk-to-reward ~1:2. Fundamental drivers would include weaker USD due to dovish Fed expectations or stronger Australian CPI data—but currently no major Aussie releases are scheduled, so this scenario relies on risk-on sentiment or USD selling.
Bearish Scenario and Trade Setup A break below 0.72026 (session low) would confirm the wedge breakdown, with initial target at 0.71610 (major support). The better sell entry is a limit order near 0.72100–0.72130 with stop-loss above 0.72180, targeting 0.71610 (risk ~30 pips, reward ~50 pips). If 0.71610 fails, the next support is 0.71430. The bearish case is reinforced by overbought RSI, bearish MACD divergence, and the wedge pattern—a classic mean-reversion setup. Fundamental headwinds: rising US Treasury yields and hawkish Fed speak (recent jobs data) could weigh on AUD. Summary: Prefer short-term shorts while respecting the 0.72150 line; only switch to bullish on a confirmed breakout with strong momentum. Monitor the 03:00 and 04:00 H1 closes for confirmation.
*The market analysis posted here is meant to increase your awareness, but not to give instructions to make a trade
 Italiano
 Русский
 English
 Bahasa Indonesia
 Bahasa Malay
 ไทย
ไทย Español
 Deutsch
 Български
 Français
 Tiếng Việt
 中文
中文 বাংলা
বাংলা हिन्दी
 Čeština
 Українська
 Română
