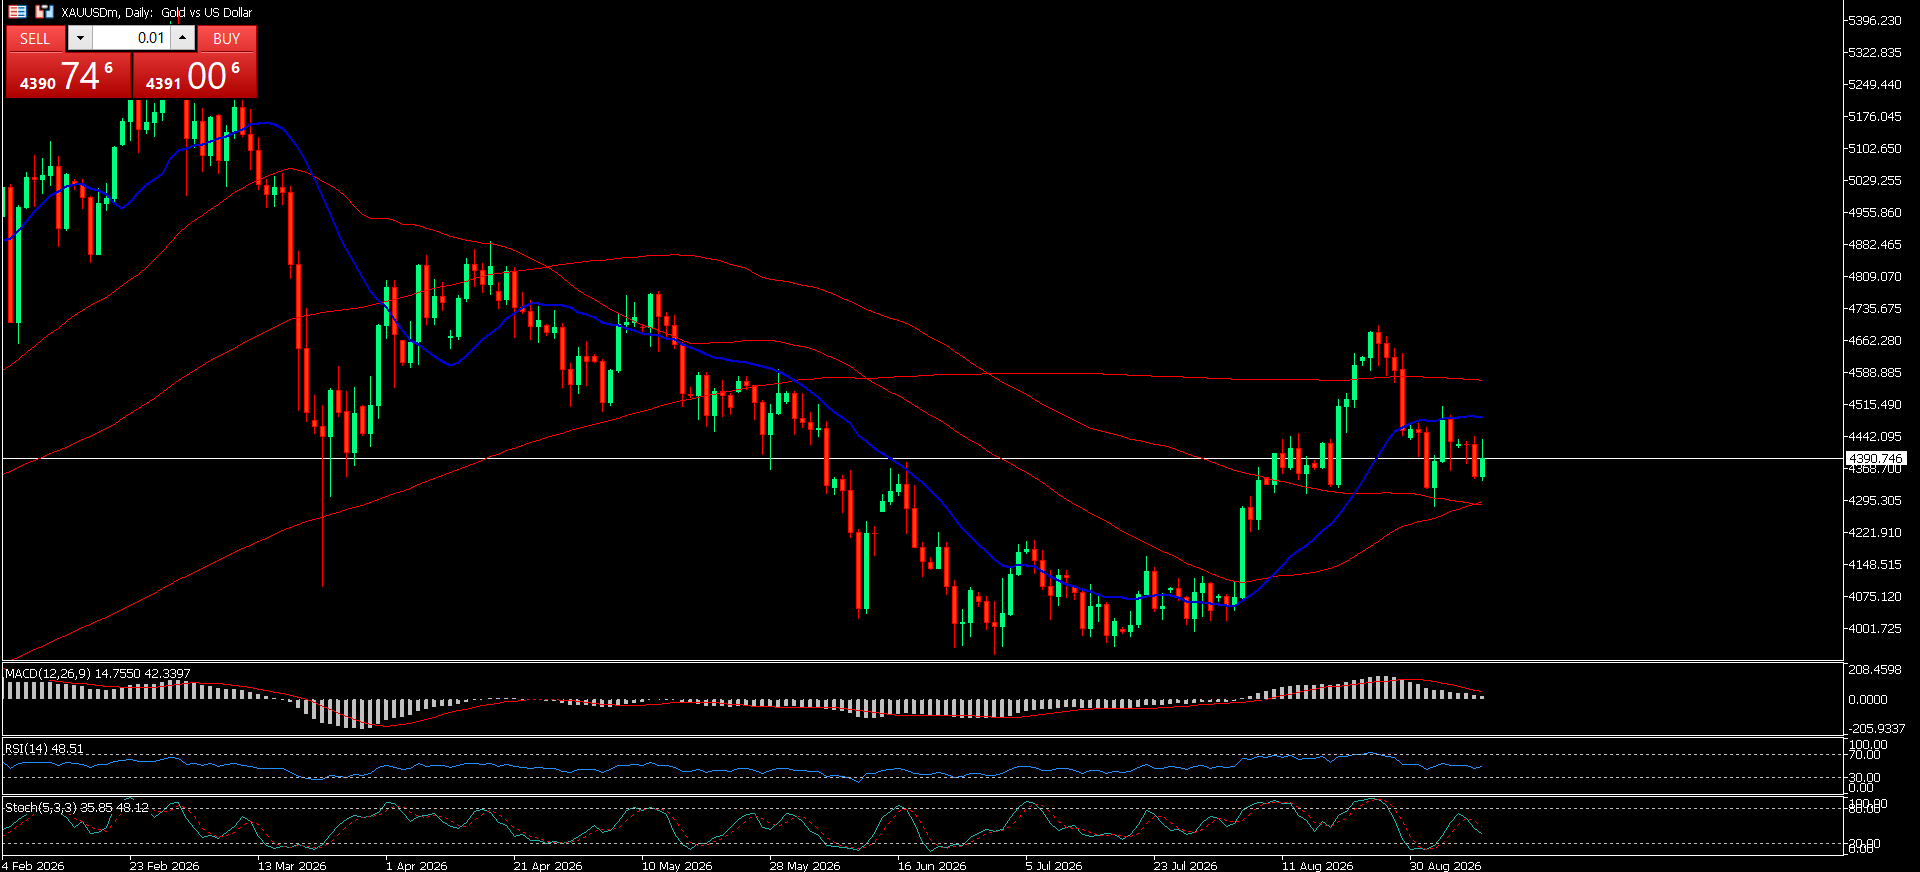
 Gold Daily Forecast
 Gold (XAU/USD) finds itself struggling to defend its Wednesday gains after bouncing off a one-week low of $4,341. Indeed, the greenback has recovered from a one-week low against other major global currencies after rising Treasury yields pressured the yellow metal. The latest XAU/USD quotes hover near $4,385 after hitting a high of $4,434 during today's trading hours. Meanwhile, the US Dollar Index (DXY) trades near 98.86 after yesterday's dip below 99.00, with DXY falling to its lowest level since August 21. Indeed, US Treasury yields are rising along the curve. The benchmark 10-year yield moves up to 4.85%, hitting the highest level since November 2023. The Treasury triggered the increase, announcing plans to repurchase $6 billion of long-term debt on September 10, well above the earlier estimated minimum of $4 billion per operation. The repurchase will target notes and bonds maturing within ten to twenty years. Furthermore, gold prices could come under downward pressure as rising oil prices follow tit-for-tat attacks between the United States (US) and Iran. The US Armed Forces reported that it had destroyed five Iranian Oil tankers when the Islamic Revolutionary Guard Corps (IRGC) made attempts to attack a US Navy warship. In retaliation, Iran targeted two US vessels, eight Oil tankers, and ten ships that tried crossing the Strait of Hormuz. Furthermore, the IRGC claimed that they have also attacked a US military installation in Jordan. Crude oil prices hover near the highest level since June 3 at 94 per barrel amid robust gains of more than 5% during the ongoing week. Concerns about sustained inflationary pressure from high energy costs are pushing central banks worldwide to tighten monetary policy, especially the Federal Reserve. As mentioned earlier, higher interest rates usually hurt precious metals, including gold, because investors flock to safe-haven assets. Indeed, CME FEDWATCH shows nearly a 60% likelihood that the Federal Reserve will implement a 25-basis-point hike next week. The producer and consumer price index data releases scheduled for Thursday and Friday will play a crucial role in shaping the Fed's rate-hike decision. According to the daily time chart, the yellow metal is trading under higher volatility. Price moved sharply to retest the weekly high of 4430 and triggered sellers. Thus, sellers pushed the price down and extended the bearish leg to 4385. However, the pair is trading above the 200-period SMA at $4356. Thus, it suggests buyers are still pushing price higher on dips. Nevertheless, the immediate ceiling resistance comes from the 50-period SMA at $4415. The RSI indicator sits around 45. At the same time, the MACD histogram prints slightly negative values. Therefore, both indicators suggest that gold is under strong selling pressure. However, on the chart, price is retesting the left shoulder of the Head and Shoulders pattern right away. Indeed, price is forming a lower-low, lower-high pattern as of now. From the buyers' perspective, if buyers regain control of the yellow metal. The initial resistance is the 50-period SMA at $4,415. Once buyers surpass the 50-period SMA at $4,415, additional resistance emerges at the 100-period SMA at $4,489. Once price moves beyond these resistances, it may test $4,550, followed by $4,700. Furthermore, if buyers find pace and pierce, $4,772 would be the next target, followed by $4,830. On the downside, if sellers regain control, initial support appears near the 200-period SMA at $4,356. If sellers find a foothold below $4,356, the next target is the H&S neckline between $4,311 and $4,282, the August 14 and September 2 lows. A clear breach below the neckline low could fuel further selling momentum toward the $4,200 support area.
*The market analysis posted here is meant to increase your awareness, but not to give instructions to make a trade
 Italiano
 Русский
 English
 Bahasa Indonesia
 Bahasa Malay
 ไทย
ไทย Español
 Deutsch
 Български
 Français
 Tiếng Việt
 中文
中文 বাংলা
বাংলা हिन्दी
 Čeština
 Українська
 Română
