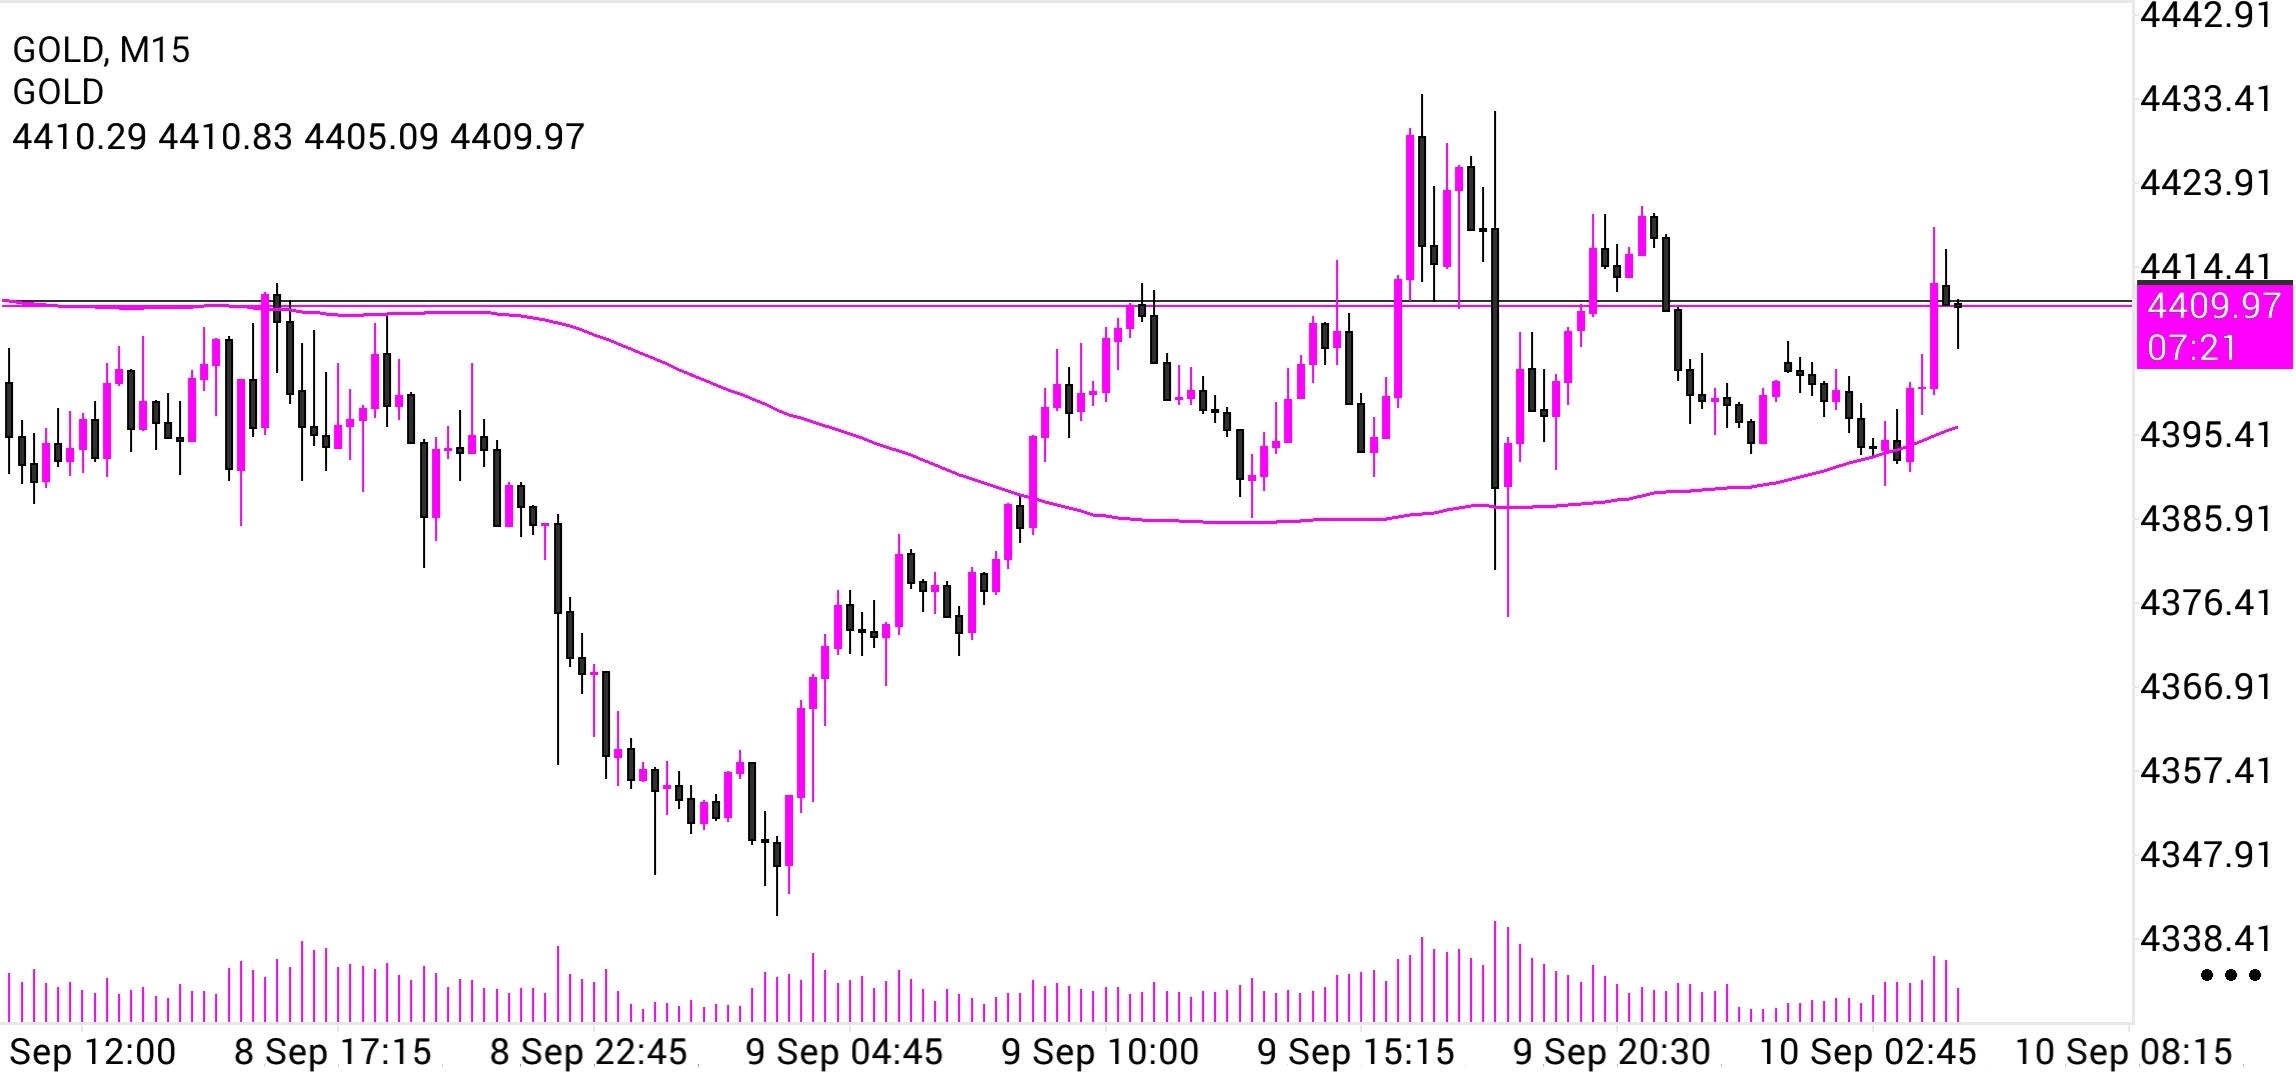
 GOLD M15: ICT Liquidity Hunts and Fair Value Gaps – A Downtrend and Current Retracement
 Looking at the Gold 15‑minute chart from 8 September to 10 September 2026, we see a clear bearish structure. Price peaked near 4442.91, then declined to 4338.41 – a drop of over 104 points. The descent was not linear; several small upward spikes interrupted the fall, each one a classic liquidity sweep above recent swing highs. Key buy‑side liquidity (BSL) pools sat above levels like 4433.41, 4423.91, and 4414.41. Notice how price would briefly rally above one of these levels, then reverse sharply downward. That is the institutional footprint: triggering stop orders of breakout buyers, using that liquidity to push prices even lower. The most recent candles show price bouncing to 4409.97 (close), with a high of 4410.83 and a low of 4405.09. This is a retrace into a fair value gap (FVG) created during the rapid decline.
1. Identifying Fair Value Gaps on the M15 Gold Chart During the drop from 4442.91 down to 4338.41, multiple 15‑minute candles created imbalances. A fair value gap appears when three consecutive candles leave a price level untouched by neighbouring wicks. From the data, a clear bearish FVG formed between 4414.41 and 4409.97 – a sharp down move left a gap. The current price at 4409.97 is exactly at the lower boundary of this FVG, suggesting the market is returning to fill that imbalance. Another smaller FVG may exist near 4395.41 – 4385.91, but price has not yet reached those levels.
2. A Simple ICT Trading Plan for Gold M15 Given the strong downtrend, the bias remains bearish unless a clear reversal structure emerges. First, mark the recent swing highs: 4442.91, 4433.41, 4423.91, and 4414.41. Also note the FVG zone: 4414.41 – 4409.97. Currently, price is hovering at the lower boundary of this FVG. Wait for a liquidity sweep above a minor high – for example, above 4410.83 (the recent high) or above 4414.41. That would hunt buy stops. After the sweep, look for a fresh bearish FVG to form just below the swept high. Enter short on a retrace into that new FVG. Place your stop loss 3‑5 points above the swept high. Target the next sell‑side liquidity (SSL) below 4338.41 – perhaps 4330 or 4320. If price instead sweeps below 4338.41 first, that would hunt sell stops and could signal a bullish reversal – then look for a bullish FVG.
3. Final Advice for Forum Members Gold on M15 is fast and volatile. Always wait for the liquidity sweep first – never short a rally without seeing the trap sprung. Currently, price is inside the 4414.41–4409.97 FVG. Do not enter here without a fresh sweep. Either wait for a spike above 4414.41 to sell, or let price drop below 4338.41 to sweep sell stops and then look for a long reversal. Keep risk at 1% per trade, use a stop of 3‑5 points, and watch those 15‑minute closes carefully. Happy trading.
*The market analysis posted here is meant to increase your awareness, but not to give instructions to make a trade
 Italiano
 Русский
 English
 Bahasa Indonesia
 Bahasa Malay
 ไทย
ไทย Español
 Deutsch
 Български
 Français
 Tiếng Việt
 中文
中文 বাংলা
বাংলা हिन्दी
 Čeština
 Українська
 Română
