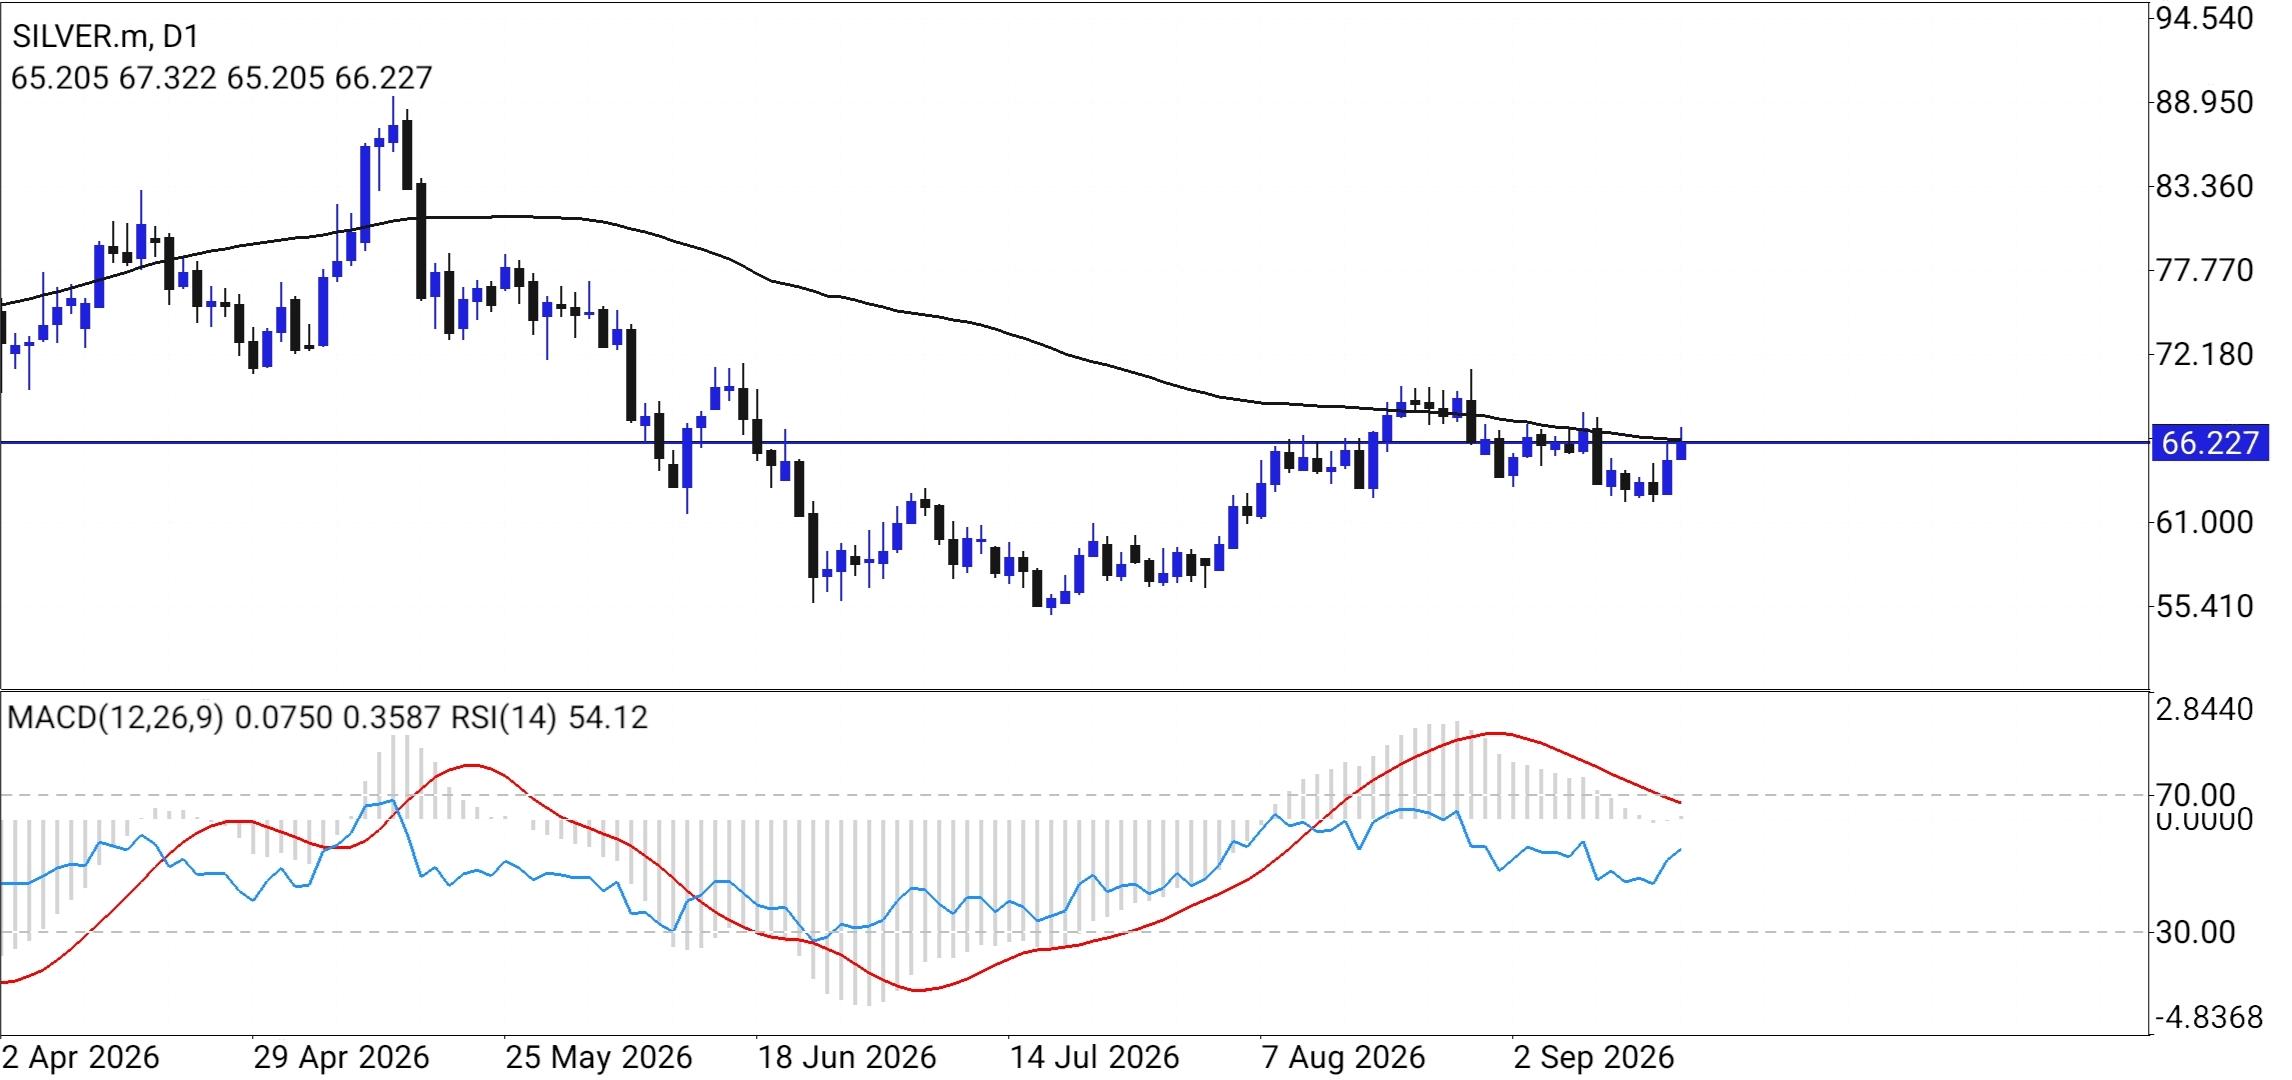
 SILVER DAILY TIMEFRAME TECHNICAL ANALYSIS Trend and Price Action
 The broader context shows a significant corrective phase. After reaching a peak near the 88.00–90.00 level in late April 2026, Silver entered a sustained downtrend that bottomed out in mid-July around 55.410. Since that low, the market has staged a strong recovery, forming a V-shaped or rounded bottom recovery pattern. The price has been making higher highs and higher lows since July, indicating a short-term bullish bias. However, the price is currently facing a critical test. The black line on the chart represents a long-term Moving Average (likely a 50 or 100-period SMA), which has been sloping downwards throughout the correction. The current price of 66.227 is testing this dynamic resistance from below. The price action here is choppy, with candles overlapping the moving average, suggesting a battle between buyers trying to push the trend higher and sellers defending the downtrend structure.
Key Levels • Immediate Support/Resistance: The horizontal blue line at 66.227 is the immediate pivot. The price is hovering right at this level. • Support: Below the current price, the next significant support lies at the 61.000 psychological level, followed by the major swing low at 55.410 (mid-July). • Resistance: The primary resistance is the descending Moving Average (currently around the 68.00–70.00 zone). A breakout above this would open the path to the 72.180 and 77.770 levels, where previous consolidation occurred.
Indicator Analysis • RSI (14): The Relative Strength Index is at 54.12. This places the asset in neutral territory. It is neither overbought (>70) nor oversold (
*The market analysis posted here is meant to increase your awareness, but not to give instructions to make a trade
 Italiano
 Русский
 English
 Bahasa Indonesia
 Bahasa Malay
 ไทย
ไทย Español
 Deutsch
 Български
 Français
 Tiếng Việt
 中文
中文 বাংলা
বাংলা हिन्दी
 Čeština
 Українська
 Română
