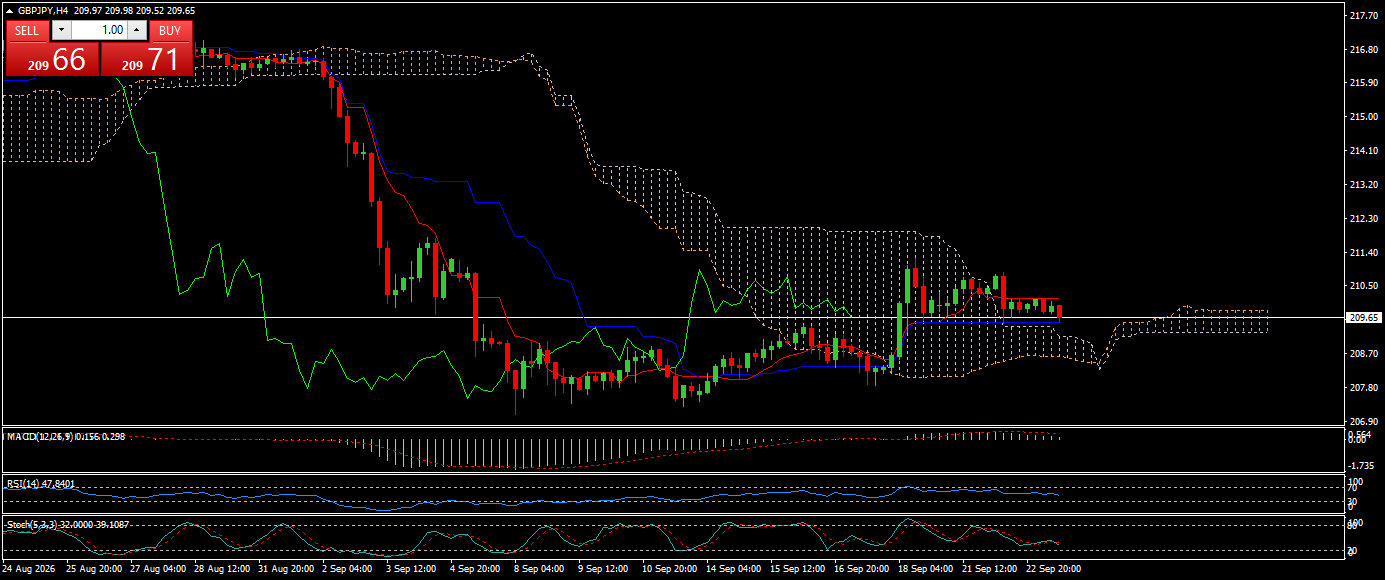
 GBPJPY H4 Technical Outlook
 GBPJPY is currently moving through a prolonged consolidation phase after the aggressive sell-off that dominated the beginning of September. The pair dropped sharply from the 216.00–216.80 region and eventually found strong demand around 207.00–208.00, where sellers began losing momentum. Since that low, price has been trying to recover, but the rebound has struggled to develop into a clean bullish reversal. GBPJPY is currently trading around 209.65, with the latest candles showing hesitation directly underneath the 210.50 area. The recent recovery toward 210.80–211.00 was rejected, and price has since returned toward the 209.50–209.70 region. For me, this leaves the market in a sensitive position, because buyers are defending the lower range while the broader H4 structure is still carrying bearish pressure. The Ichimoku structure is particularly important here. Price remains below the main cloud overhead, while the forward cloud continues to provide a large resistance area stretching roughly from 210.50 toward 213.20. This means that even though GBPJPY has recovered considerably from the 207.00 region, the pair has not yet broken the larger bearish structure. The first obstacle is around 210.50–211.00, where the recent rebound failed. Above that, the cloud becomes increasingly important, with 211.40–212.30 acting as intermediate resistance before the stronger 213.20 area. As long as price remains underneath this cloud, I would treat the current recovery as a corrective move rather than a confirmed trend reversal. A sustained H4 close above 213.20 would be needed to significantly change that structure. At the same time, the downside levels remain clearly visible on the chart. The 208.70 area has been repeatedly tested during the recent consolidation and is currently acting as the first meaningful support beneath price. If sellers manage to push GBPJPY below 208.70, attention would quickly shift toward 207.80, followed by the major lower support around 206.90. This region is important because it represents the base from which the latest recovery started. A decisive break below 206.90 would therefore damage the entire recovery structure and put the pair back into a much deeper bearish phase. On the other hand, holding 208.70 and producing another bullish reaction could keep the pair trapped inside the current 208.70–210.50 range for longer. The momentum indicators are not giving a strong bullish confirmation either. The RSI (14) is around 47.48, sitting just below the neutral 50 level. This shows that momentum is slightly tilted toward sellers, although it is nowhere near an oversold condition. The Stochastic oscillator is around 32.00 and 39.11, which indicates that short-term momentum has cooled significantly from the upper levels seen during the earlier rebound. This could allow another short-term recovery if buyers step in around support, but it does not yet provide enough evidence for a sustained upside move. The MACD has improved considerably from the deeply negative momentum seen during the initial September decline, with the histogram recovering and the lines moving closer toward equilibrium. However, the overall indicator picture still needs confirmation from price breaking above the Ichimoku resistance before I would consider the bullish side dominant. For the current setup, I am watching 209.50–209.80 as the immediate decision area, but I would prefer a clearer reaction before entering. A rejection from 210.50–211.00 would provide the cleaner selling opportunity, especially if an H4 candle returns below 209.50 after testing that resistance. In that scenario, the first downside target would be 208.70, followed by 207.80 and potentially 206.90 if the selling pressure accelerates. The alternative bullish scenario would require GBPJPY to reclaim 210.50 and then break through 211.40, opening the way toward 212.30 and 213.20. Until that happens, the cloud overhead remains a major technical obstacle. Overall, GBPJPY remains technically vulnerable while price stays below the Ichimoku cloud and the 210.50–211.00 resistance area. The current consolidation does give buyers an opportunity to build another recovery, but they need to prove that strength by clearing the overhead cloud rather than repeatedly failing beneath it. My preferred scenario is therefore to watch for a rejection around 210.30–210.80 and target the lower support levels, while keeping the bearish setup invalidated if price establishes itself above 212.35. If that breakout occurs, the focus would shift toward 213.20 and the broader recovery would deserve a fresh assessment. Until then, the 208.70–210.50 range remains the key battlefield, with the next decisive break likely determining the following H4 move.
*The market analysis posted here is meant to increase your awareness, but not to give instructions to make a trade
 Italiano
 Русский
 English
 Bahasa Indonesia
 Bahasa Malay
 ไทย
ไทย Español
 Deutsch
 Български
 Français
 Tiếng Việt
 中文
中文 বাংলা
বাংলা हिन्दी
 Čeština
 Українська
 Română
