 US Dollar Index Forecast
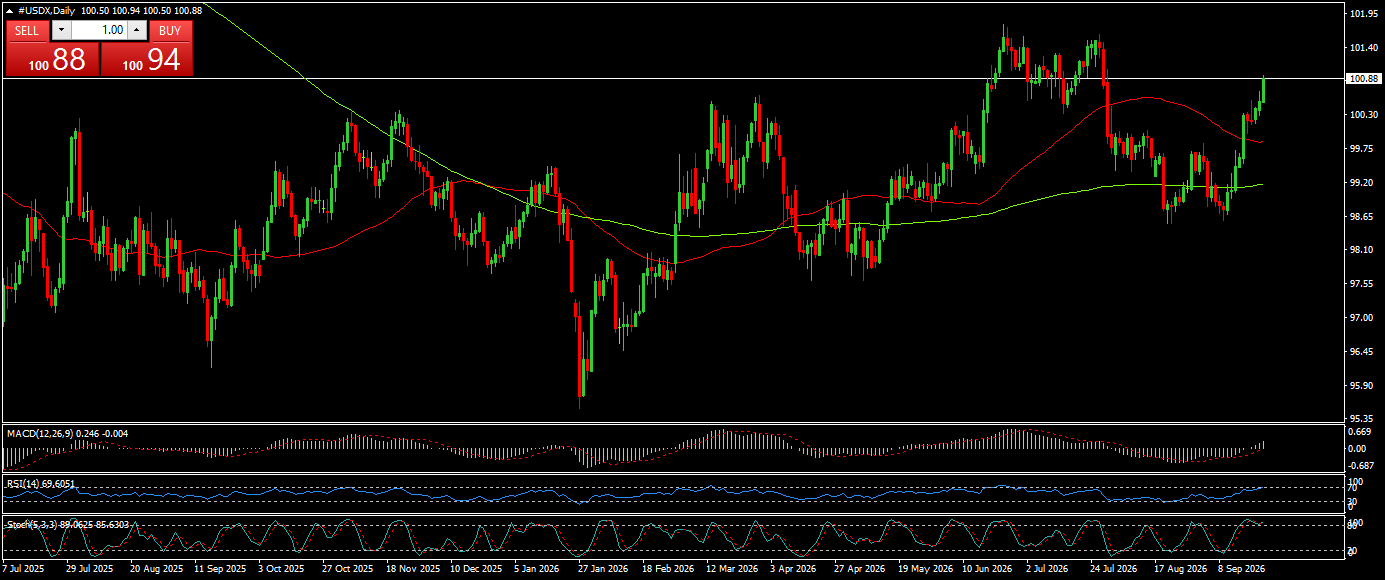
 Navigating Wednesday's trading session, the US Dollar Index (#USDX) on the daily chart exhibits powerful bullish momentum, driving toward the major 100.88 resistance level as fundamental drivers perfectly align with technical indicators. From a fundamental perspective, market participants are actively digesting the latest macroeconomic catalyst: recent policy statements from Federal Reserve Vice Chair for Supervision Michael Barr regarding central bank liquidity operations and banking system resilience. Barr emphasized structural regulatory updates surrounding the Federal Reserve's discount window facilities and standing repo mechanisms, urging major banking institutions to pre-position sufficient liquid collateral to seamlessly handle sudden intraday deposit outflows. He noted that enhancing operational readiness at the discount window effectively reduces systemic funding risks and strengthens overall money market stability without imposing unnecessary strain on broader monetary policy transmission. This proactive stance on liquidity management from Barr, combined with ongoing market expectations surrounding the FOMC's broader interest rate trajectory, has injected fresh fundamental confidence into the Greenback, causing demand for the dollar to surge across major currency pairs. Examining the technical layout on the daily chart, price action has staged a decisive breakout above both the red fast moving average and the green 200-period moving average, confirming that buyers are in firm structural control as the index presses directly against the 100.88 horizontal threshold. Turning to the lower indicator panel, the technical momentum setup fully validates this upward expansion without signaling immediate exhaustion; the Relative Strength Index (RSI) is holding near the 69.60 mark, demonstrating aggressive buying pressure while staying just underneath overbought territory. Simultaneously, the MACD histogram has expanded deeper into positive territory above the zero line at 0.246, while the Stochastic oscillator is curving sharply upward around 89.06, reinforcing strong multi-indicator alignment. To translate this dual fundamental and technical framework into a practical execution plan, I am closely watching the immediate pullback boundary between 99.75 and 100.30 as a primary long entry zone. Establishing long positions within this demand area targets a primary upside objective at 101.40, with an extended target reaching toward the major multi-month resistance barrier near 101.95. Risk must be managed prudently by placing a protective stop loss safely below the 200-period moving average support at 98.90. Conversely, a daily close beneath 98.90 would invalidate this bullish trajectory, opening the path for a deeper corrective retracement toward 98.10. Staying patient for price confirmation inside our buy zone remains my preferred approach to capitalizing on today's dollar rally.
*The market analysis posted here is meant to increase your awareness, but not to give instructions to make a trade
 Italiano
 Русский
 English
 Bahasa Indonesia
 Bahasa Malay
 ไทย
ไทย Español
 Deutsch
 Български
 Français
 Tiếng Việt
 中文
中文 বাংলা
বাংলা हिन्दी
 Čeština
 Українська
 Română
