 Gold (XAU/USD) Daily Outlook Update
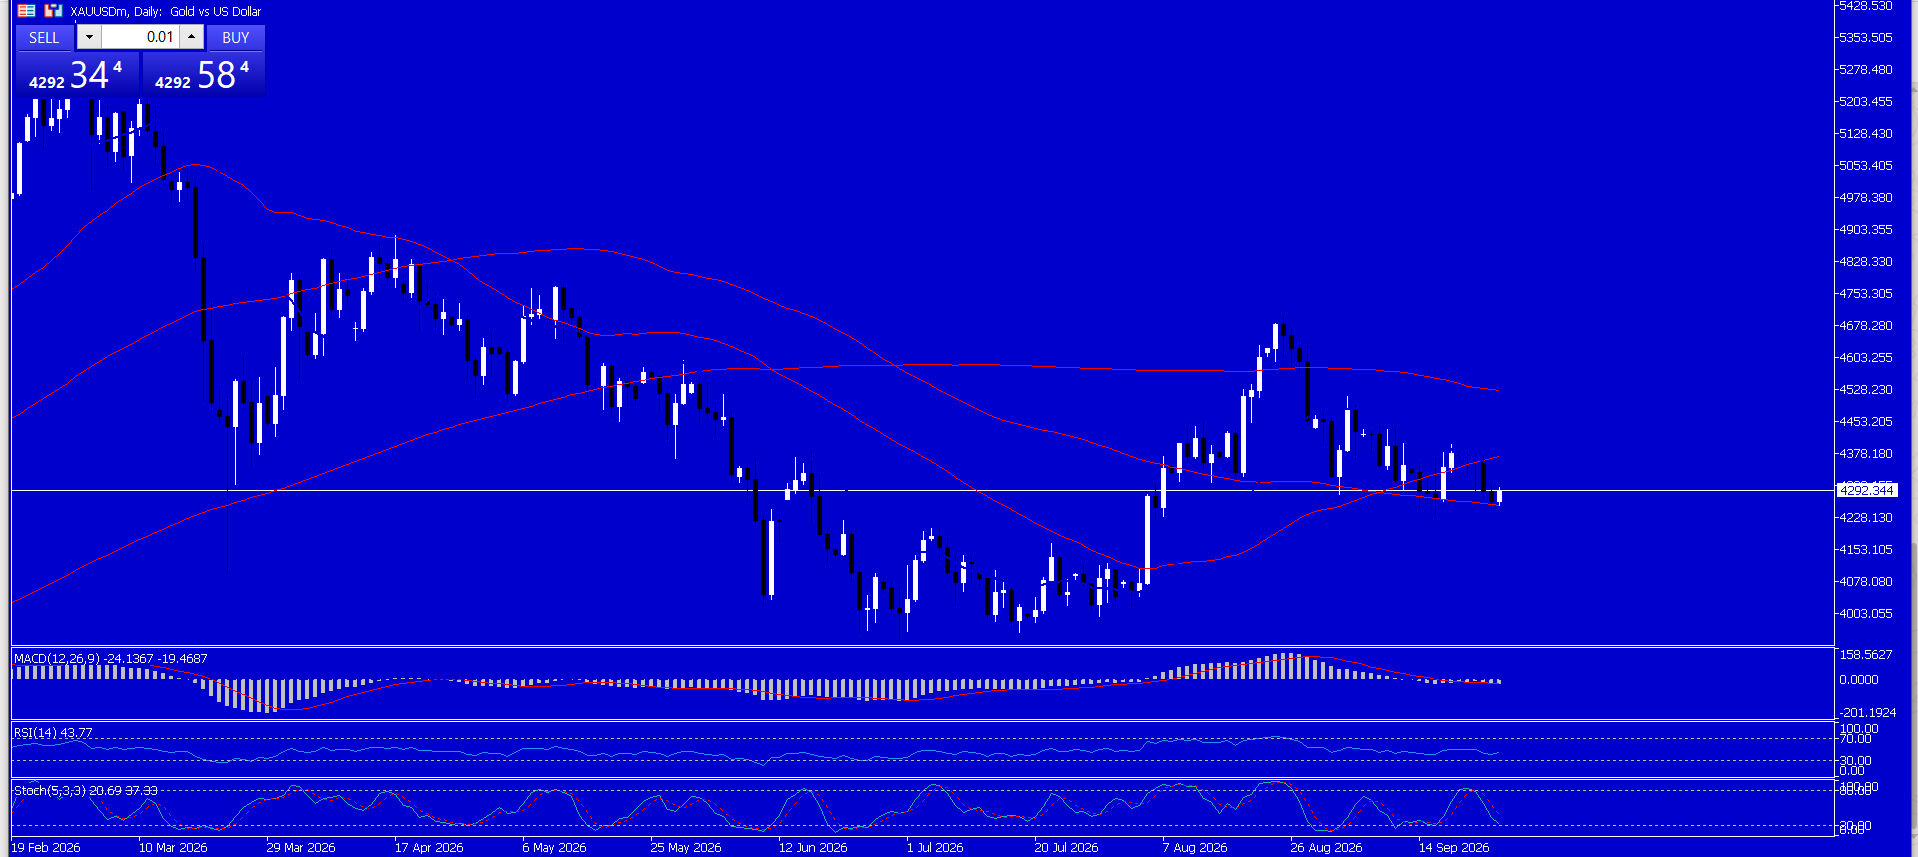
 Gold (XAU/USD) is still struggling to show any significant action, stuck in a narrow range near its weekly lows as the European trading session starts today, Friday. The US dollar (USD) pulled back after an aggressive rise took it to a two-month high, offering some relief to the commodity market. However, the overall environment from the Federal Reserve of the US, rising US bond yields, and ongoing geopolitical concerns supports USD strength. All of this is keeping the precious metal under pressure and trading below $4,300. The speech by the Fed appears to signal a definite shift toward a hawkish stance after the September rate hike, with indicators pointing to the possibility of further tightening ahead. To start, Fed Governor Michael Barr commented on Wednesday that if inflation is high and the economy is strong, the Federal Reserve of the United States would have no option but to continue rate hikes. Moreover, a private survey found that activity in US businesses reached its highest level since July 2021, while input prices peaked in the last four years. Fed Chair Williams spoke boldly, and his FXS Speechtracker score reached 7.2 out of 10, above the average of 6.2 out of 10. This high score suggests a still-hawkish approach compared with the previous one. Several aspects were highlighted: the “remarkable resilience” of the American economy, lower risks of reaching maximum employment, strong demand driven by artificial intelligence, and the view that an additional rate increase by year-end will be reasonable. These factors suggest the Federal Reserve remains focused on fighting inflationary pressure while no longer offering forward guidance; however, the FXS Fed Sentiment Index has decreased by 0.18 points to 148.63, showing a slight weakening of hawkish intensity despite the Fed chair's strong score on the FXS Speechtracker. Although the index remains well above the neutral level of 100, the Fed's stance is clearly hawkish, supporting the US dollar. In addition, inflation risks have been fueled by high energy prices due to the political crisis in the Middle East and the looming possibility of a 90-day ban on US diesel shipments. All these factors support the prospect of further monetary policy tightening by the Fed. Consequently, yields on US government bonds have moved up to record levels. Notably, the 10-year yield on US Treasuries is at its highest level since July 2007. This is positive for the dollar and negative for gold, an asset with no income-producing capacity. At the same time, uncertainty about how the US-Iran crisis will be settled in the coming months continues to support the dollar's short-term safe-haven prospects and discourages positions in gold. In terms of recent developments, Trump said earlier in the week that he was considering the possibility of using very tough military measures against Iran. In addition, Iranian President Masoud Pezeshkian made claims that Iran is committed to its nuclear program and will not back down from pressure from the US, which leaves the question of whether or not the two countries could agree on peace open. Further adding complexity to the situation, Iran-friendly Houthi rebels in Yemen used missiles and drones to attack a very sensitive location in Riyadh, Saudi Arabia and facilities belonging to Aramco. These actions imply a higher geopolitical risk premium and point to a stronger USD, so XAU/USD bears should be cautious. The precious metal continues to show a bearish stance in the short term, trading below key technical levels that cap upside moves. More precisely, it is trading below the 50.0% retracement point based on the June-to-August rise and also below the 200-period Simple Moving Average (SMA) on the 4-hour chart. The 200-period SMA coincides with the 38.2% Fibonacci retracement point of $4,408, forming a significant resistance area that will prevent any upside move. In terms of momentum, the Moving Average Convergence Divergence (MACD) indicator remains negative and below its signal line, indicating bearish market movement. The Relative Strength Index (RSI) stands at 42, well off its overbought area, meaning that there is still some room left for downside movement before reaching oversold conditions. Nonetheless, a move lower through the 61.8% Fibonacci retracement support at $4,231 is required to confirm deeper losses to the 78.6% retracement support at $4,105, and then eventually toward the prior cycle lows around $3,945 if the prevailing downward trajectory continues. To the upside, resistance is at the 50.0% Fibonacci retracement at $4,320, followed by stronger resistance where the 38.2% retracement level at $4,408 overlaps with the 200-period moving average at $4,417.
*The market analysis posted here is meant to increase your awareness, but not to give instructions to make a trade
 Italiano
 Русский
 English
 Bahasa Indonesia
 Bahasa Malay
 ไทย
ไทย Español
 Deutsch
 Български
 Français
 Tiếng Việt
 中文
中文 বাংলা
বাংলা हिन्दी
 Čeština
 Українська
 Română
