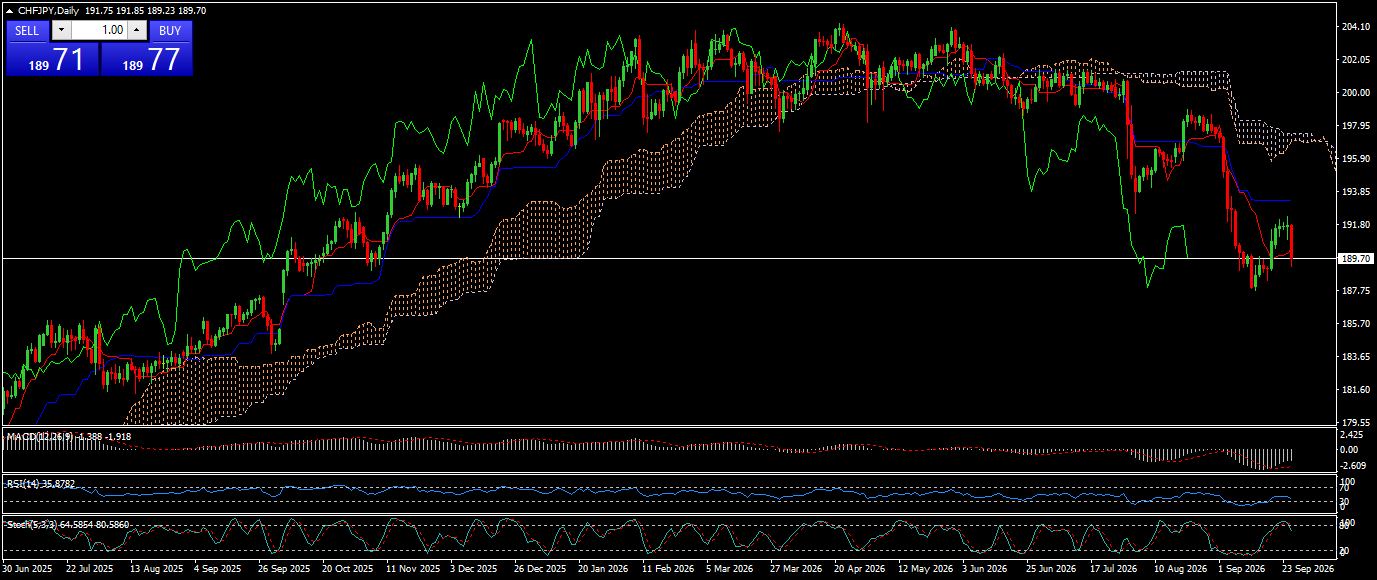
 CHF/JPY UPDATE
 as i sit down this sunday evening to carefully chart out my trading strategy before the market opens tomorrow, my undivided attention is fully dedicated to the chf/jpy daily timeframe where the current spot price is floating right around 189.70 after experiencing a prolonged bearish impulse. taking a step back to analyze my overall technical structure, i can clearly see that the price action has suffered a major breakdown below my custom ichimoku cloud layer, which has effectively shifted the broader market regime from a strong bullish rally into a heavy corrective downtrend. after the pair printed a fresh swing low down near the 187.75 liquidity zone, we saw a minor bullish pause, and i am treating this current consolidation at 189.70 as a textbook retest of broken support now turned into resistance, as well as a direct collision with my red tenkan-sen moving line. my primary plan for tomorrow's opening bell revolves around a short position bias, provided that the market fails to overcome the critical resistance ceiling sitting between 191.80 and 193.85, where my blue kijun-sen line and previous structure breakdown points align. if I observe strong rejection wicks or early selling volume around this 189.70 to 191.80 region during the asian session, my execution trigger will be to jump into a sell trade with my first take-profit target placed squarely at the 187.75 support floor, and my extended secondary profit target mapped out down toward the major macro support level at 185.70. to maintain rigorous risk management on this setup, my protective stop loss will be placed tightly above the 193.85 swing high level to safeguard my trading equity against any sudden upside volatility spikes. diving into my secondary indicator confirmation, i notice that my macd histogram is deeply anchored in negative territory reading -1.388 with its signal line down at -1.918, which reassures me that the dominant momentum is still heavily tilted in favor of the bears. additionally, my rsi(14) indicator is holding at a weak 35.87 level, staying comfortably below the neutral 50 threshold without hitting extreme oversold conditions yet, telling me there is plenty of room left for sellers to drive price deeper into lower support pockets. looking at my stochastic oscillator (5,3,3), the main line is sitting at 64.58 and the signal line at 80.58, which highlights to me that the recent upward bounce was merely a temporary relief rally inside a primary downtrend, now reaching an overbought exhaustion point right inside my supply zone. naturally, i always keep an alternative bullish scenario prepared in my playbook, so if tomorrow brings an aggressive surge in buying volume that pushes price cleanly above my 193.85 invalidation level, i will immediately scrap my short bias and look for long setups targeting the lower bound of the ichimoku cloud near 195.90, using a stop loss placed safely under 189.70. for now, my eyes are glued to how the spreads settle at the open and whether 189.70 holds as resistance.
*The market analysis posted here is meant to increase your awareness, but not to give instructions to make a trade
 Italiano
 Русский
 English
 Bahasa Indonesia
 Bahasa Malay
 ไทย
ไทย Español
 Deutsch
 Български
 Français
 Tiếng Việt
 中文
中文 বাংলা
বাংলা हिन्दी
 Čeština
 Українська
 Română
