 BTC/USD UPDATE
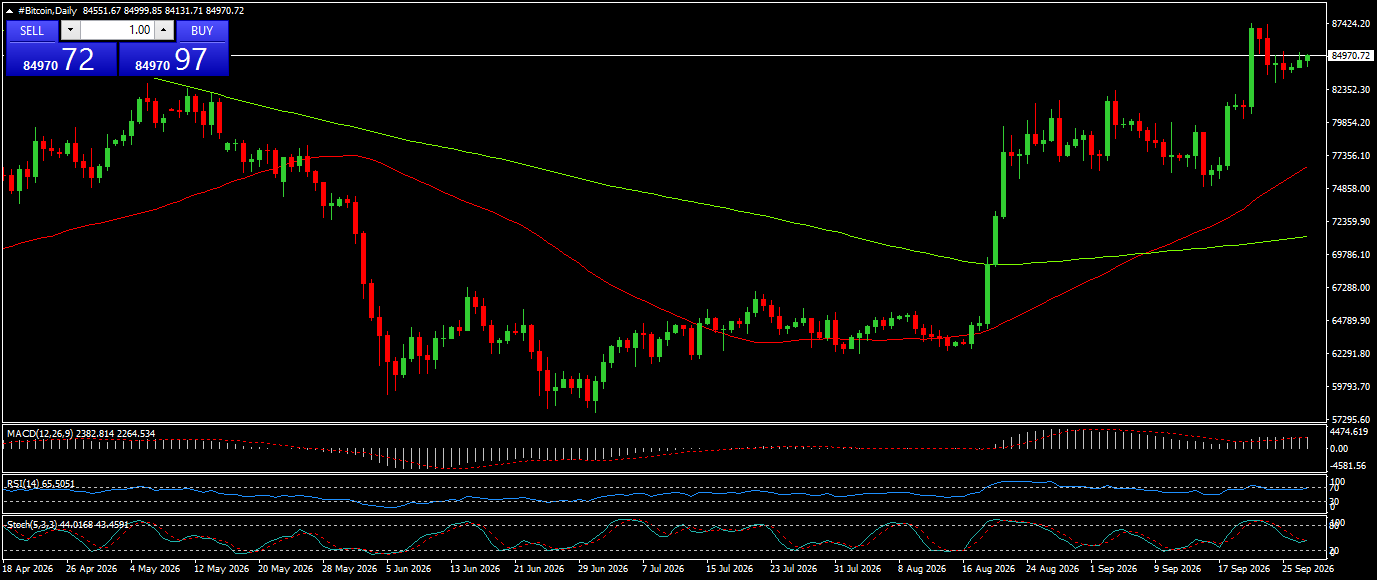
 Bitcoin is currently flexing serious bullish muscle across the daily timeframe, holding exceptionally strong near the 84970 mark after printing a fresh local peak around the 87424 resistance barrier. Ever since price smashed cleanly through that macro green descending trendline, my trading bias has been strictly geared toward buying dips rather than trying to top-tail this aggressive rally. The structural picture remains extraordinarily healthy, with candle bodies comfortably floating well above both my red dynamic moving average and the lower green trend line, signaling that buyers are fully in the driver's seat. Right now, this sideways consolidation around 84970 looks like a standard pause for breath right below the major 87424 swing high, allowing market participants to absorb recent gains before targeting higher levels. If we see a minor pullback over the next few sessions, the key area I'm watching for new long entries spans between 82352 and 79854, which represents a highly sensitive support floor where buyers previously stepped in with aggressive volume. Entering near this 82352 zone gives me an optimal risk-to-reward ratio, setting my primary upside target back at the 87424 ceiling, with a secondary extension projected toward the psychological 90000 handle. To protect my portfolio against potential black-swan liquidations, placing a firm stop loss right underneath 77356 ensures my downside risk stays completely controlled if the short-term structure crumbles. Taking a quick glance at my underlying oscillator suit, the MACD(12,26,9) reading is exceptionally strong with the histogram sitting at 2382.814 and the signal line at 2264.534, proving that buying pressure is far from exhausted. Meanwhile, the RSI(14) is cruising comfortably at 65.5051—a sweet spot that confirms strong bullish momentum without entering extreme overbought territory, meaning there is still plenty of runway for a secondary expansion wave. Over on the Stochastic oscillator (5,3,3), the main line at 44.0168 and signal line at 43.4591 show a healthy mid-range reset, which often precedes another bullish cross-over during strong trending markets. Should the market surprise us with an unexpected macro breakdown below my key invalidation support at 74858, I will immediately close out long positions and prepare for a deeper correction toward the green moving average around 72359. Until that invalidation level is breached, however, my plan is to stay patient, ride this powerful upward cycle, and take advantage of any shallow dips into support.
*The market analysis posted here is meant to increase your awareness, but not to give instructions to make a trade
 Italiano
 Русский
 English
 Bahasa Indonesia
 Bahasa Malay
 ไทย
ไทย Español
 Deutsch
 Български
 Français
 Tiếng Việt
 中文
中文 বাংলা
বাংলা हिन्दी
 Čeština
 Українська
 Română
