 Silver (XAG/USD) Daily Outlook Update
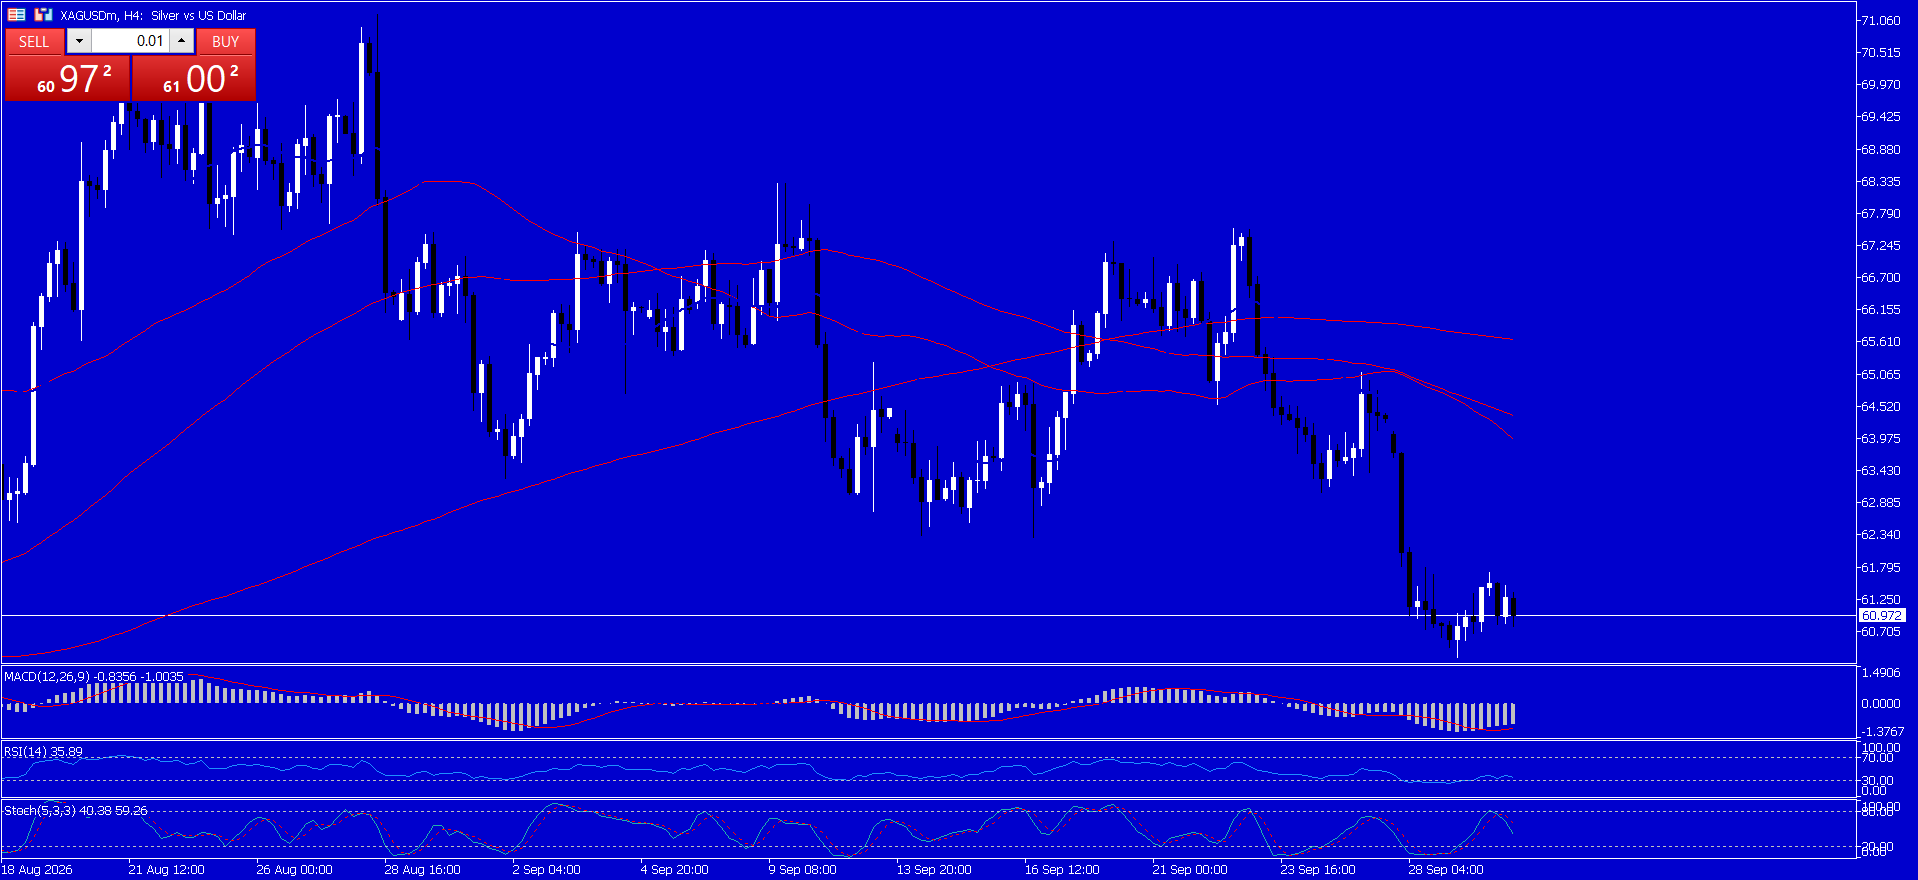
 Silver (XAG/USD) is trading narrowly around $61.00 in the European session on Wednesday. The precious metal is consolidating ahead of the release of US Personal Consumption Expenditures (PCE) Price Index data for August, scheduled for 12:30 GMT. Inflation in the United States (US) PCE data will be in focus for market participants because the Federal Reserve (Fed) officials have made it clear that high price pressures are one of their biggest concerns. Fed officials have also said inflation pressure is driven by both the energy shock and strong AI-driven demand. Core PCE inflation, closely watched by Fed members, is projected to remain stable at 3.3% Year-on-Year (YoY), though it is expected to rise faster month-on-month at 0.3% than the previous month’s 0.2%. Inflation numbers are expected to play an important role in shaping Fed interest rate expectations. Meanwhile, financial markets believe the Fed will prolong its monetary tightening cycle through the rest of the year. According to TD Securities, “an October hike is looking more likely,” and the bank argues that the Fed will be “unlikely to regain its confidence in inflation progress before the October meeting.” Since “most participants expect further tightening,” TD economists argue that “it does not make sense to wait until December to hike again,” emphasizing the fact that the policy bias is still “skewed towards more tightening.” A Fed rate hike would benefit interest-bearing instruments, such as Treasury Yields, while negatively affecting non-interest-bearing instruments, such as Silver. Ahead of the US PCE Inflation data release, investors will watch the ADP Employment Change data for September. The data will reflect the creation of 70K new private-sector jobs, up from 38K last month. This week, the main catalyst for Fed interest-rate expectations will be the September Nonfarm Payrolls (NFP) data. The XAG/USD currency pair on the daily chart is currently trading at $61.32 and is below the 20-period exponential moving average of $64.09, suggesting a continuation of a bearish near-term trend. Trading below this key indicator suggests recent gains have lost steam, especially since the RSI (14) at 40.66 is neutral, indicating sellers are in control without an overbought condition. Resistance is initially at $62.26, after which the 20-day EMA barrier sits around $64.09, above which bearish pressure may subside. Support is initially seen at the psychological level of $60. On the daily chart, XAG/USD is hovering around $61.00 and continues its negative near-term outlook by staying below the 20-day exponential moving average (EMA) of $64.09. This price action, as it tries to trade below this crucial trend-line reference, clearly shows that recent positive momentum is fading. As of this writing, the Relative Strength Index (14) has declined to 40.66, placing it in a neutral-to-weak range, and buyers have yet to regain control. On the bulls' side, short-term resistance is now around $62.26, while the next level to watch is the 20-day EMA at $64.09. Any rebound attempt will meet selling interest here, and a strong break above it will be needed to alleviate the prevailing downtrend. On the downside, critical support is the round figure of $60.
*The market analysis posted here is meant to increase your awareness, but not to give instructions to make a trade
 Italiano
 Русский
 English
 Bahasa Indonesia
 Bahasa Malay
 ไทย
ไทย Español
 Deutsch
 Български
 Français
 Tiếng Việt
 中文
中文 বাংলা
বাংলা हिन्दी
 Čeština
 Українська
 Română
