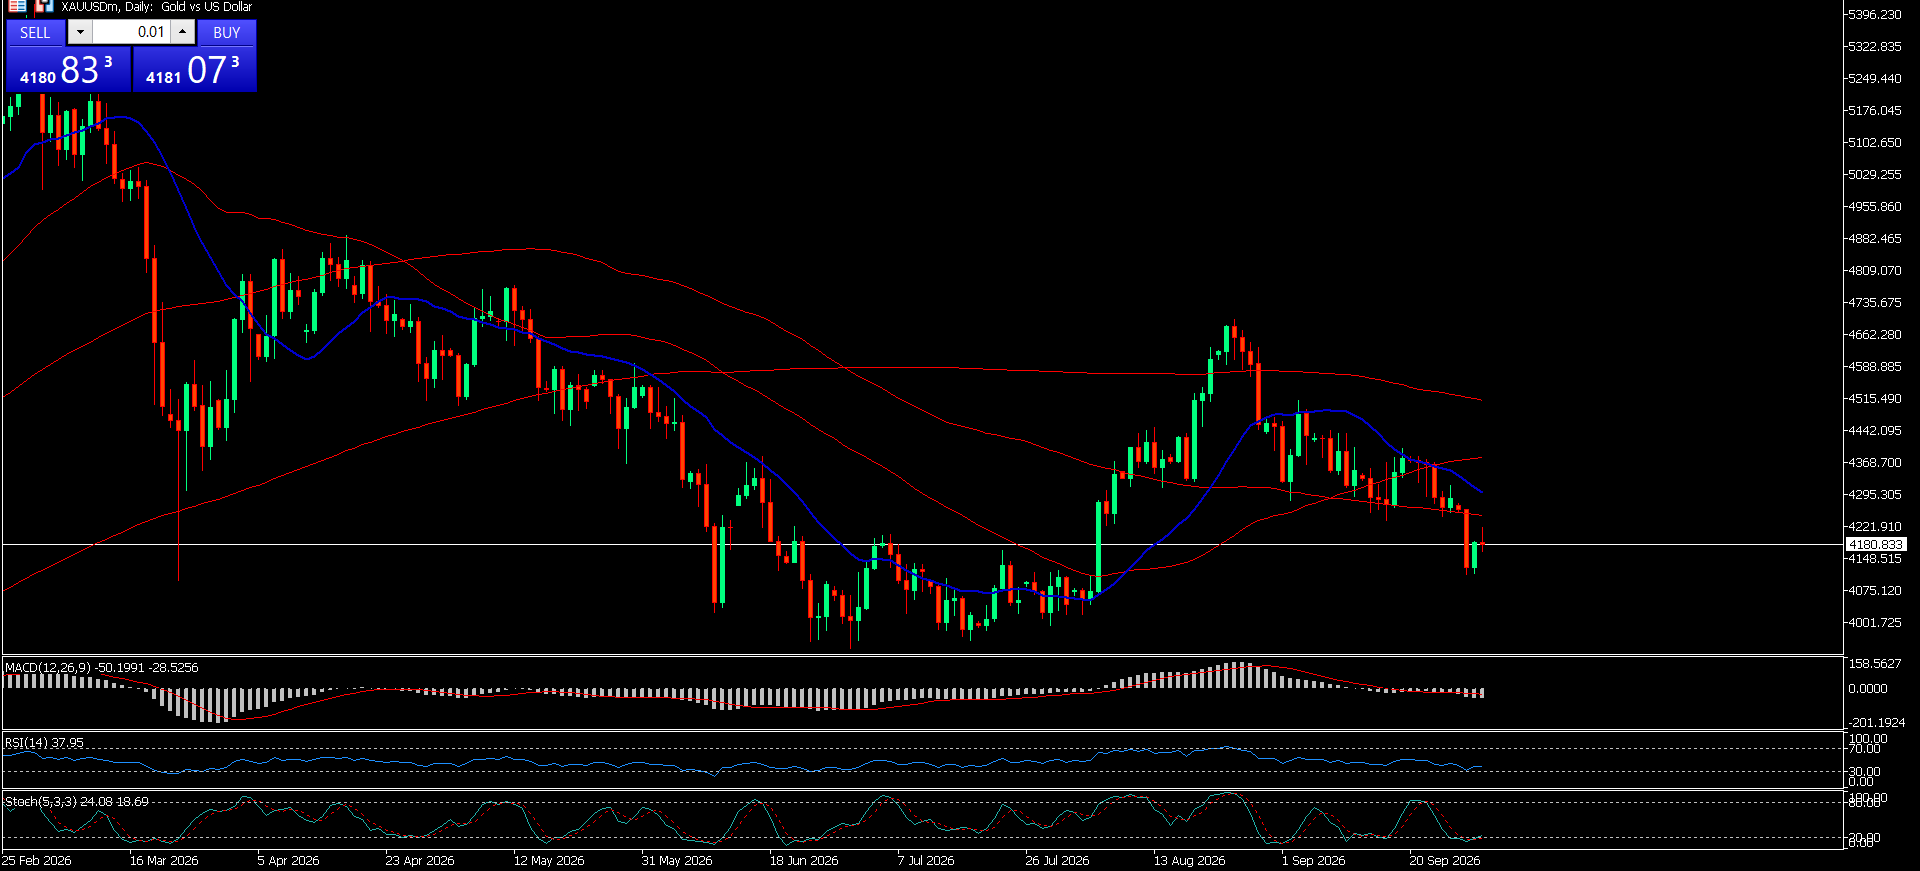
 Gold Daily Forecast
 Gold (XAU/USD) is trading somewhat stronger on Wednesday, building on its previous rally as it recovered from its lowest level in seven weeks, recorded on Monday. A decline in the US Dollar (USD) and US Treasuries is boosting gold prices amid lower-than-anticipated US Personal Consumption Expenditures (PCE). XAU/USD is trading around $4,180, having gained 0.45% during today's session. US Bureau of Economic Analysis data showed the core PCE Price Index rose 0.2% MoM in August, below the expectedated .3%, and higher than the previous 0.1% reading. PCE inflation rose 0.3% MoM, again below expectations of 0.4% and up from the previous 0.1%. Annually, core and headline PCE Inflation remained unchanged at 3% and 3.4%, respectively. Nevertheless, stronger growth and employment data partially offset the softer inflation print and capped the retreat in the US Dollar and Treasury yields. The US economy grew 2.2% year-on-year in Q2, exceeding the expected 1.5% and the prior estimate of 1.3%. Meanwhile, the ADP Employment Change gained 90K in September, outperforming the expected increase of 70K and coming in above the previous reading of 36K. The US Dollar Index (DXY), which measures the strength of the Greenback against a basket of six currencies, is currently trading near 101.20 after hitting a two-month high of 101.61 on Tuesday. The key US 10-year Treasury yield is currently trading at 5.23% versus 5.29% on Tuesday, which marked its highest level since 2007. Relatively soft data has eased expectations for another Fed rate hike in October, with the chances of an increase down to about 37%, from 70% earlier this week, according to the CME FedWatch Tool. In addition, comments by John Williams, President of the New York Fed, on Tuesday have helped traders lower expectations of an interest rate hike in the coming months. "Given the policy action we have taken at our September meeting, there is no sense of urgency," said Williams. "If the economy unfolds in line with my forecasts, a single further adjustment of the federal funds target range upwards would be warranted late this year to facilitate a timely return of inflation to target." Inflation is expected to continue to overshoot the Fed's 2% target, with policymakers keen to tame inflation pressures. In the projections published after the FOMC meeting held in September, the policy rate was expected to reach 4.1% in 2026. This suggests policymakers will most likely raise interest rates one final time before 2025. These expectations continue to weigh on gold as the yellow metal drifts into negative territory. However, energy-induced inflation concerns might dissipate if crude oil output in the Middle East improves. According to Reuters, Saudi Arabia resumed loading tankers at Yanbu after opening its East-West Pipeline. Goldman Sachs said Gulf oil exports averaged 2025 levels last week. The United States also said it would release 40 million barrels of oil from the Strategic Petroleum Reserve. The next focus point will be Friday's release of the US Non-farm Payrolls (NFP). On the daily chart, the yellow metal is trading under a bearish bias at $4,180. The pair gradually rebounded from the $4,110 low. However, after the release of ADP Non-Farm Employment Change, Core PCE Price Index m/m, Final GDP q/q, and Final GDP Price Index q/q, the price moved sharply to 4220 and then declined sharply. Meanwhile, XAU/USD encounters resistance near $4,100, which is also the 78.6% Fibonacci retracement level of the previous uptrend from June to August. Gold keeps a bearish near-term bias as price holds beneath the 50-day, 100-day, and 200-day Simple Moving Averages (SMAs) clustered between roughly $4,288 and $4,538. Therefore, the $4,227 mark becomes a temporary cap before the 200 EMA at $4,307 and the midpoint Fib. Retracement level of $4,317. While XAU/USD continues to trade below the 200-day EMA, the move is expected to remain capped. Higher on the chart, the $4,406 level (38.2% retracement) and the $4,517 level (23.6% retracement) mark the upper bound. According to the oscillator indicator, the Relative Strength Index (RSI) at 40 sits below its midline. At the same time, the Moving Average Convergence Divergence (MACD) indicator remains in negative territory. Both indicators suggest downside momentum still outweighs recovery attempts, despite the recent stabilization around $4,100. From the bulls' perspective, initial resistance appears at the 100-day SMA at $4,288. Once buyers surpass the first next bar, the next barrier is the 50-day SMA at $4,322. The 200-day SMA reinforces the broader bearish structure near $4,538, along with a horizontal barrier at $4,700. On the downside, immediate support is at the horizontal level of $4,100, the 78.6% Fibo retracement. Once sellers find a foothold below 4100, it would open the door to a deeper floor around $4,000. definitive fall from this point will create the way for an even stronger retreat to the $3,937 level. However, a break would open the way for an extension of the prevailing corrective phase towards $3,900, followed by $3,780.
*The market analysis posted here is meant to increase your awareness, but not to give instructions to make a trade
 Italiano
 Русский
 English
 Bahasa Indonesia
 Bahasa Malay
 ไทย
ไทย Español
 Deutsch
 Български
 Français
 Tiếng Việt
 中文
中文 বাংলা
বাংলা हिन्दी
 Čeština
 Українська
 Română
