 GOLD H1 TIMEFRAME ANALYSIS
 Based on the provided H1 (1-Hour) chart for Gold (GOLD.m), here is a technical analysis of the current market structure and momentum.
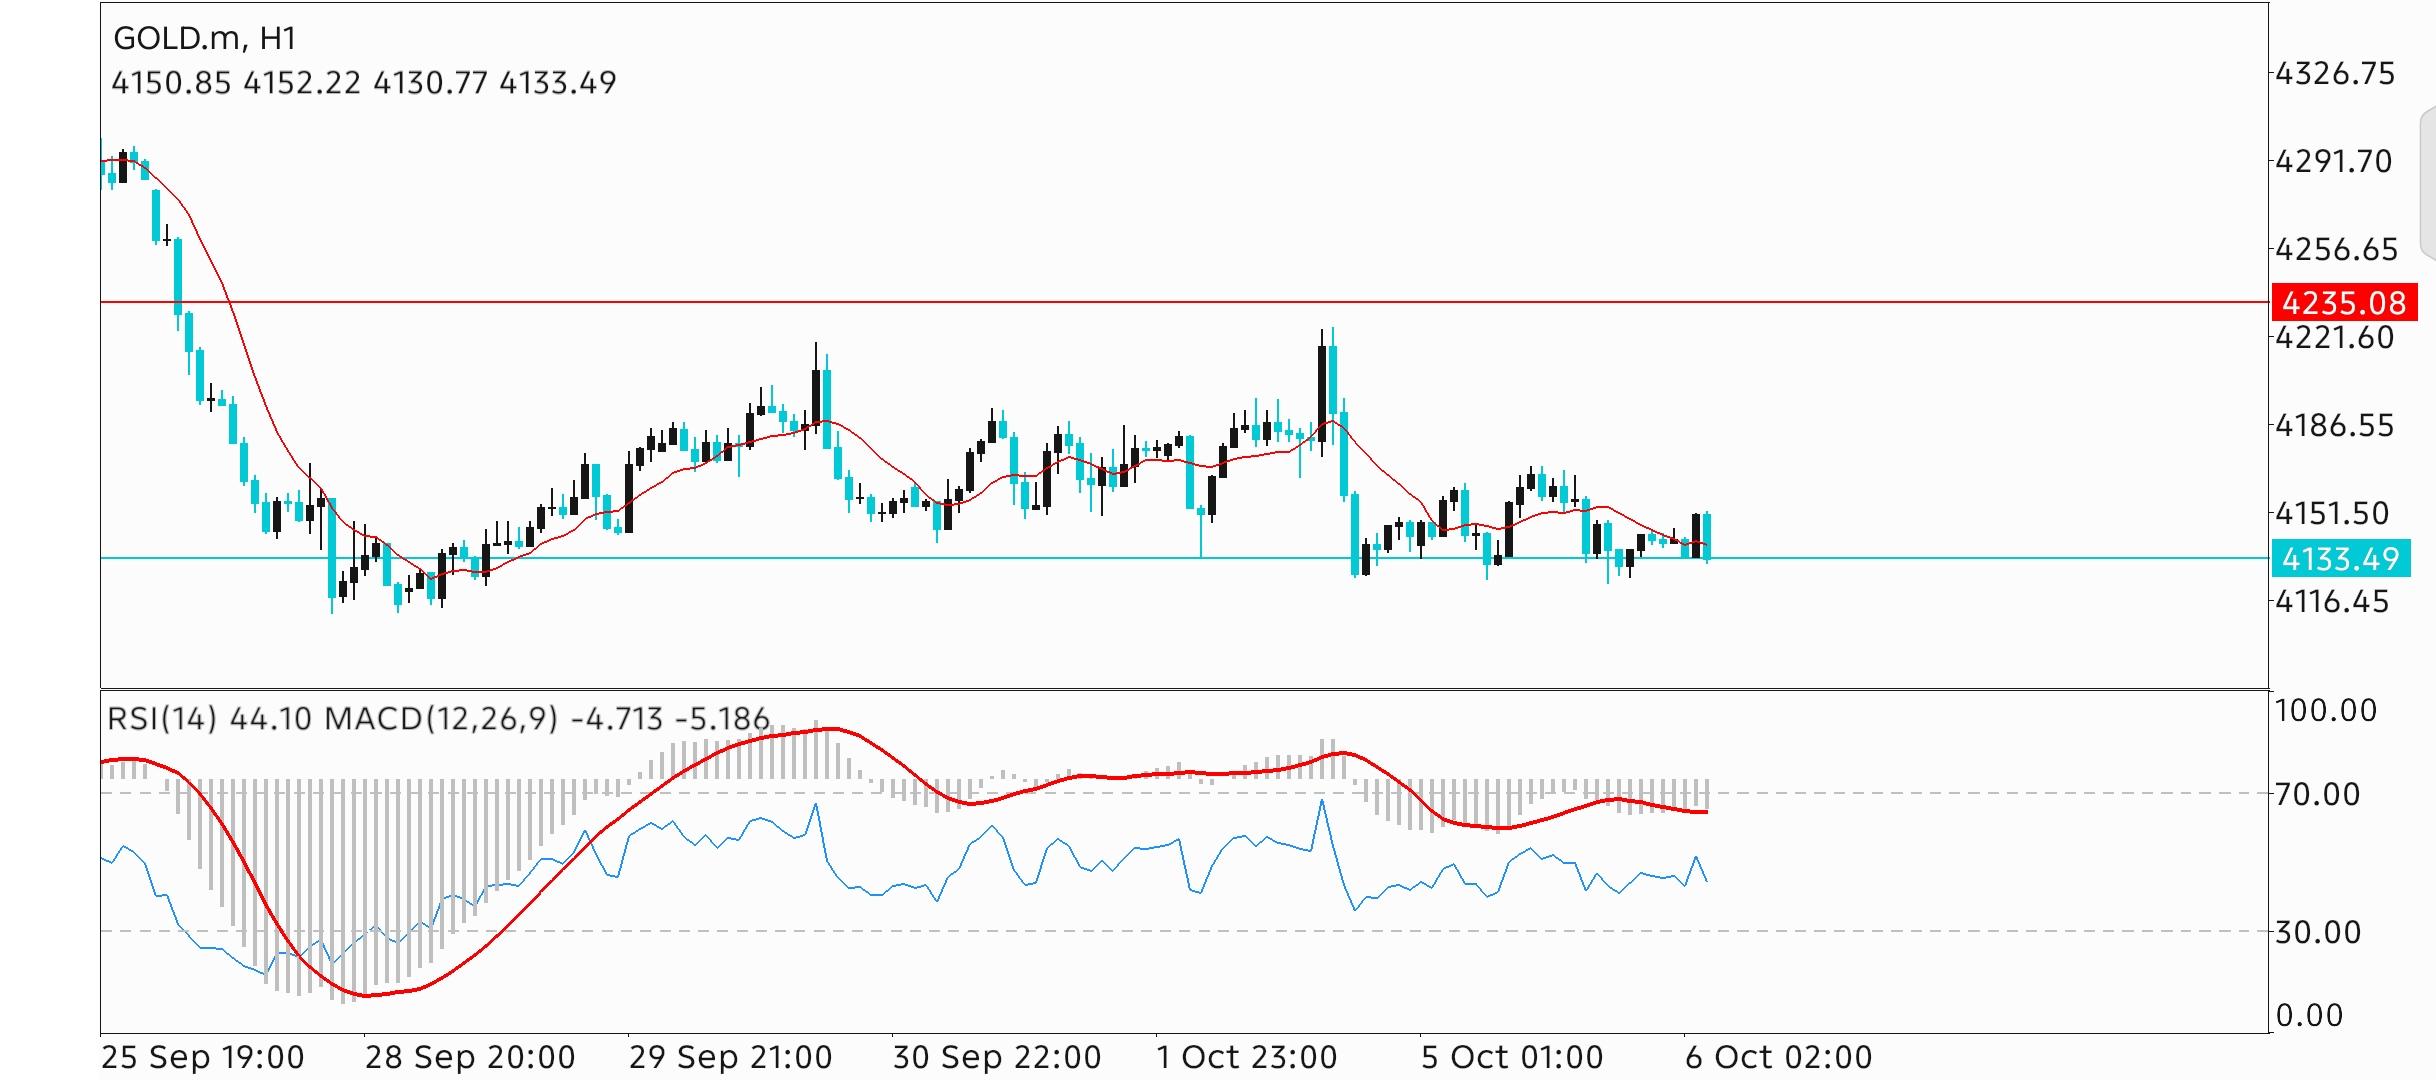
Market Overview and Price Action The chart depicts a volatile period for Gold, covering the timeframe from late September to early October 2026. The market is currently trading at 4133.49. The dominant feature of this chart is a sharp, aggressive sell-off that occurred around September 25-28, where the price plummeted from the 4290 region down to a low of approximately 4116. Following this crash, the market entered a corrective consolidation phase. However, this recovery has been weak and characterized by a pattern of lower highs. The price rallied to around 4220, then pulled back, rallied again to roughly 4210, and most recently peaked near 4186. This failure to reclaim previous highs suggests that sellers are still in control and the overall trend remains bearish. The current candle (Open: 4150.85, Close: 4133.49) is bearish, indicating immediate selling pressure.
Key Support and Resistance Levels Resistance: The most significant overhead resistance is marked by the red horizontal line at 4235.08. This level likely acted as support previously and is now a major barrier. Closer, immediate resistance is found at the recent swing high of 4186.55 and the red Moving Average line, which is currently hovering around the 4150 level. Support: The price is currently testing the cyan horizontal support line at 4133.49. This is a critical "line in the sand." If this level fails to hold, the next major support is the recent swing low at 4116.45. A break below 4116 could open the door for further downside expansion.
Indicator Analysis Moving Average (Red Line): The red Moving Average in the main window is sloping downwards and acting as dynamic resistance. The price is trading below this line, which confirms the short-term bearish bias. The fact that the price recently touched the MA around October 2nd and rejected it further validates its role as resistance. RSI (14): The Relative Strength Index is currently at 44.10. This reading is below the 50 midline, indicating that bearish momentum is dominant. However, it is not yet in the "oversold" territory (below 30), which implies there is still plenty of room for the price to drop further before a technical bounce becomes inevitable. MACD (12, 26, 9) The MACD indicators are negative, with values at -4.713 and -5.186. Negative MACD values confirm that the trend is down. The histogram (grey bars in the sub-window) shows that momentum has waned since the late September highs, and the oscillator lines are hovering in the lower half of the chart, consistent with a weak market.
Conclusion The technical outlook for Gold on the H1 timeframe is bearish. The market structure of lower highs and the price trading below the moving average suggests that the path of least resistance is down. Traders should watch the 4133.49 support level closely. A breakdown below this level targets the 4116 lows. Conversely, for a bullish reversal to be confirmed, the price would need to break above the moving average and clear the 4186 resistance level.
*The market analysis posted here is meant to increase your awareness, but not to give instructions to make a trade
 Italiano
 Русский
 English
 Bahasa Indonesia
 Bahasa Malay
 ไทย
ไทย Español
 Deutsch
 Български
 Français
 Tiếng Việt
 中文
中文 বাংলা
বাংলা हिन्दी
 Čeština
 Українська
 Română
