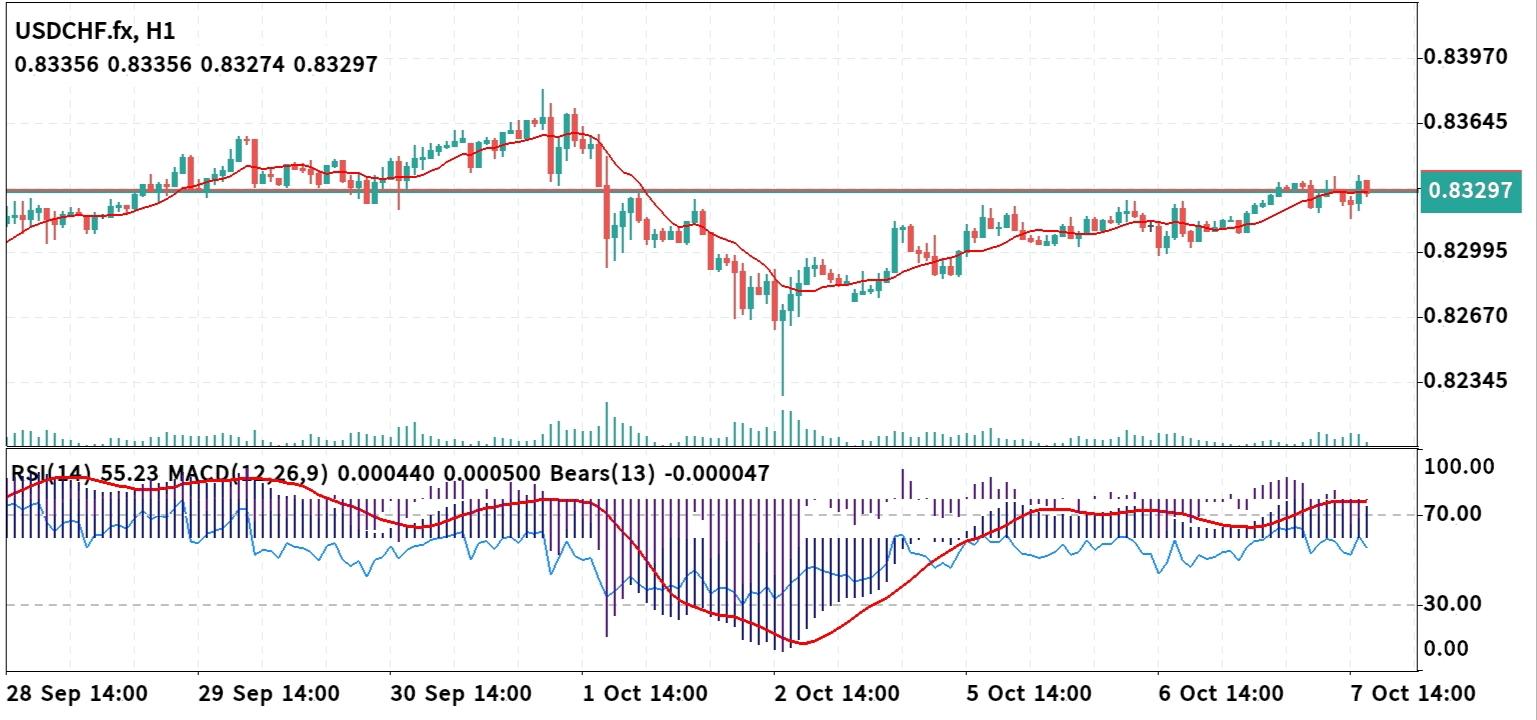
 Technical Analysis 07 October 2026 USD/CHF H-1
 The USD/CHF 1-hour chart displays a steady recovery trend following a major dip to the 0.82345 support level on October 2. Price action has ascended above its dynamic 50-period moving average and is now retesting the horizontal resistance baseline near 0.83297, presenting a crucial decision zone for traders. 1. Market Structure & Trend Analysis * V-Shaped Rebound: Following the sharp downside drop to 0.82345, buyers initiated a step-by-step rally, forming higher lows and riding along dynamic support. * Horizontal Pivot Baseline: The horizontal line at 0.83297 represents former support turned resistance. A clean H1 candle close above this level confirms a breakout toward upper resistance levels at 0.83645. * Dynamic Support: The 50-period moving average (red line) is sloping upward beneath current price candles around 0.83150, serving as trailing dynamic support. 2. Technical Indicators * RSI (14): Reads 55.23, holding comfortably above the 50 midline, which signals steady bullish sentiment without entering overbought conditions. * MACD & Bears Indicator: The MACD histogram sits near neutral at 0.000440 below its signal line (0.000500). The Bears Power indicator reads -0.000047, reflecting negligible selling pressure during current consolidation. 3. Point-to-Point Trade Setup Scenario A: Bullish Continuation (Primary Breakout Setup) * Trigger: An H1 candle close cleanly above 0.83350 (confirming a hold above the horizontal pivot baseline). * Entry Point: Buy Market / Buy Stop at 0.83380 (or Buy Limit on a pullback to 0.83300). * Stop Loss (SL): 0.82950 (placed below recent swing structure and dynamic MA support). * Take Profit (TP1): 0.83645 (intermediate resistance top). * Take Profit (TP2): 0.83970 (major structural high target). * Risk/Reward Ratio: ~1:1.6 (TP1) / ~1:2.4 (TP2) Scenario B: Bearish Rejection (Contrarian Setup) * Trigger: An H1 bearish rejection pattern closing cleanly below 0.83100 (losing dynamic MA support). * Entry Point: Sell Market / Sell Stop at 0.83050. * Stop Loss (SL): 0.83450 (placed above the horizontal pivot baseline). * Take Profit (TP1): 0.82800 (intermediate structural support floor). * Take Profit (TP2): 0.82500 (retest of lower liquidity zone). * Risk/Reward Ratio: ~1:1.6 (TP1) / ~1:2.3 (TP2) Execution Summary Focus closely on how the current hourly candle closes relative to 0.83297. A verified close above 0.83350 opens the way toward 0.83645 and 0.83970, whereas a drop below 0.83100 signals potential pullback toward 0.82800.
*The market analysis posted here is meant to increase your awareness, but not to give instructions to make a trade
 Italiano
 Русский
 English
 Bahasa Indonesia
 Bahasa Malay
 ไทย
ไทย Español
 Deutsch
 Български
 Français
 Tiếng Việt
 中文
中文 বাংলা
বাংলা हिन्दी
 Čeština
 Українська
 Română
