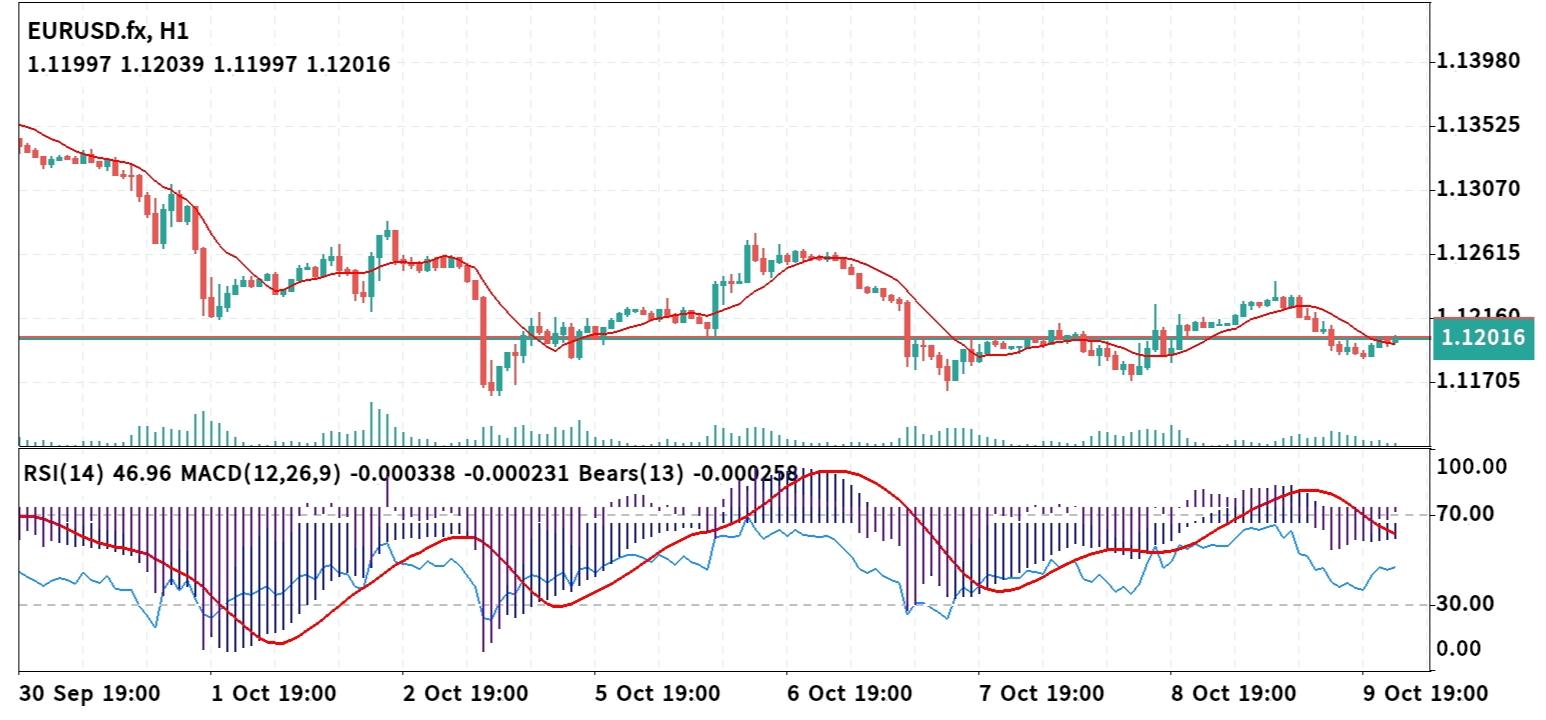
 Technical Analysis 10 October 2026 EUR/USD H-1
 The EUR/USD 1-hour chart exhibits tight range-bound consolidation following a minor pullback from the 1.12160 area. Price action is hovering directly around its dynamic 50-period Moving Average and testing the horizontal decision line near 1.12016, establishing a crucial inflection point for short-term direction. 1. Market Structure & Trend Analysis * Consolidation at Pivot: Following a rebound from the 1.11705 support floor, EUR/USD faced dynamic resistance near 1.12160 before retracing to test the horizontal baseline at 1.12016. * Horizontal Baseline Axis: The horizontal line at 1.12016 serves as the primary structural boundary. Holding cleanly above this level keeps the recovery structure valid toward 1.12615, whereas an H1 breakdown opens path back toward lower support. * Moving Average Dynamic: The 50-period moving average (red line) is flattening right along price action near 1.12016–1.12160, signaling neutral-to-balanced momentum prior to a directional move. 2. Technical Indicators * RSI (14): Reads 46.96, holding just below the neutral 50 line, indicating balanced market control with a slight bearish tilt following the recent minor dip. * MACD & Bears Indicator: The MACD histogram sits slightly negative at -0.000338 below its signal line (-0.000231). The Bears Power indicator reads -0.000258, reflecting weak downside momentum during current range consolidation. 3. Point-to-Point Trade Setup Scenario A: Bullish Continuation (Primary Breakout Setup) * Trigger: An H1 candle close cleanly above 1.12160 (confirming a push over dynamic MA resistance). * Entry Point: Buy Market / Buy Stop at 1.12190 (or Buy Limit on a retest of 1.12020). * Stop Loss (SL): 1.11700 (placed safely below key structural support at 1.11705). * Take Profit (TP1): 1.12615 (retest of intermediate high). * Take Profit (TP2): 1.13070 (major structural resistance target). * Risk/Reward Ratio: ~1:1.6 (TP1) / ~1:2.4 (TP2) Scenario B: Bearish Breakdown (Contrarian Short Setup) * Trigger: An H1 candle close cleanly below 1.11950 (losing horizontal baseline support). * Entry Point: Sell Market / Sell Stop at 1.11920. * Stop Loss (SL): 1.12250 (placed safely above local dynamic resistance). * Take Profit (TP1): 1.11705 (retest of major support floor). * Take Profit (TP2): 1.11400 (extended downside projection). * Risk/Reward Ratio: ~1:1.6 (TP1) / ~1:2.5 (TP2) Execution Summary Focus closely on how the hourly candle closes relative to 1.12016 and 1.12160. A confirmed close above 1.12160 favors long setups targeting 1.12615 and 1.13070, while a drop below 1.11950 re-engages downside pressure toward 1.11705.
*The market analysis posted here is meant to increase your awareness, but not to give instructions to make a trade
 Italiano
 Русский
 English
 Bahasa Indonesia
 Bahasa Malay
 ไทย
ไทย Español
 Deutsch
 Български
 Français
 Tiếng Việt
 中文
中文 বাংলা
বাংলা हिन्दी
 Čeština
 Українська
 Română
