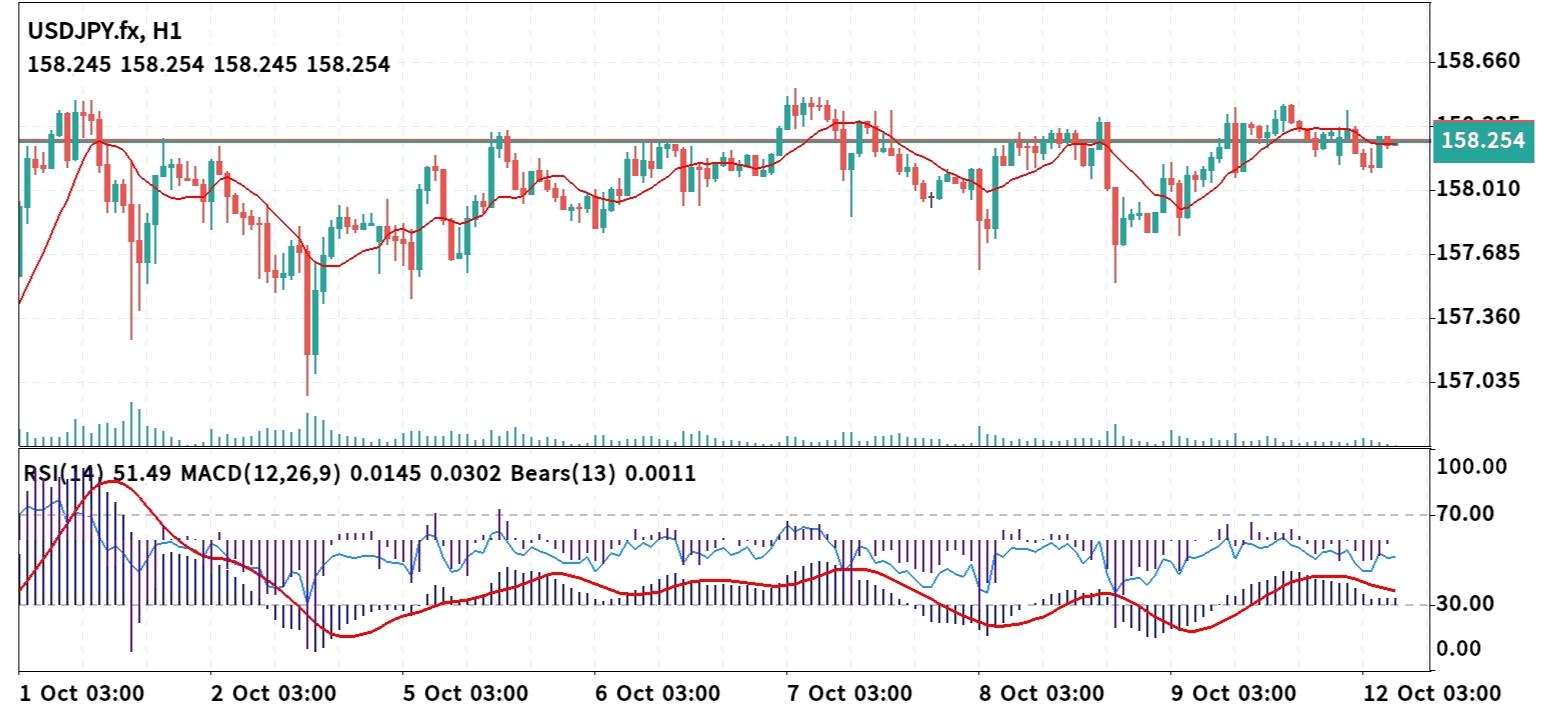
 Technical Analysis 12 October 2026 USD/JPY H-1
 The USD/JPY pair is currently consolidating directly on a key horizontal pivot zone on the 1-hour timeframe. After recovering from earlier swing lows, price action is hovering around a critical decision point where buyers and sellers are battling for direction. Below is a point-by-point technical breakdown along with exact actionable trade entry setups. 1. Core Technical Overview & Indicators * Current Price Action: USD/JPY is trading at 158.254, hovering right on top of a major horizontal support/resistance line. Price is moving closely along the red moving average line, showing range compression. * RSI (14): Currently sits at 51.49. Hovering right around the neutral 50 level, indicating a balanced market without clear overbought or oversold conditions. * MACD (12,26,9): Sits virtually flat near zero (0.0145 main line vs 0.0302 signal line) with shrinking histogram bars, reflecting low volume and short-term consolidation. * Key Support Zone: 157.68 – 158.00 (Solid demand region where price bounced strongly on Oct 8 and Oct 9). * Key Resistance Zone: 158.45 – 158.66 (Recent swing peaks tested on Oct 6 and Oct 9). 2. Actionable Trade Entry Setups Bullish Continuation Setup (Buy) * Entry Trigger: Buy on a confirmed H1 candle close above 158.35 or a bullish rejection off the 158.00 support level. * Take Profit 1 (TP1): 158.65 (Recent swing high) * Take Profit 2 (TP2): 159.00 (Psychological round number target) * Stop Loss (SL): 157.95 (Below immediate structure support) Bearish Breakdown Setup (Sell) * Entry Trigger: Sell on a confirmed H1 candle close below 158.00. * Take Profit 1 (TP1): 157.68 (Previous key swing low) * Take Profit 2 (TP2): 157.35 (Deeper demand floor from Oct 2) * Stop Loss (SL): 158.40 (Above local resistance level) 3. Trading Strategy & Risk Management Since both RSI and MACD are displaying neutral signals, traders should avoid placing market orders directly at the mid-point price (158.25). Wait for a clear H1 candle body close beyond 158.35 for long entries or below 158.00 for short opportunities to ensure momentum is on your side. Always risk a maximum of 1-2% per trade with a strict 1:2 Risk-to-Reward ratio. Would you like me to adjust this analysis for a specific trading style, such as quick scalping or multi-day swing trading?
*The market analysis posted here is meant to increase your awareness, but not to give instructions to make a trade
 Italiano
 Русский
 English
 Bahasa Indonesia
 Bahasa Malay
 ไทย
ไทย Español
 Deutsch
 Български
 Français
 Tiếng Việt
 中文
中文 বাংলা
বাংলা हिन्दी
 Čeština
 Українська
 Română
