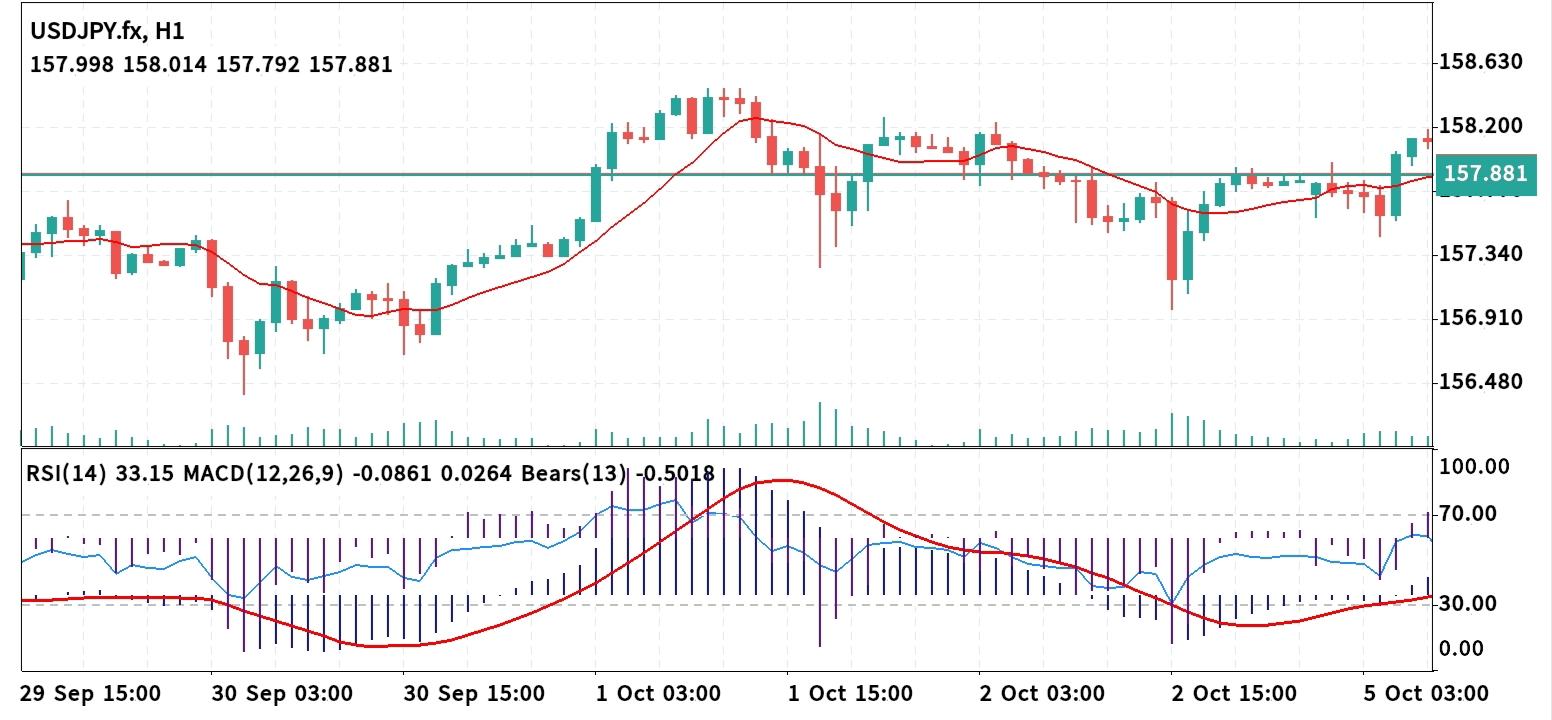
 Technical Analysis 15 October 2026 USD/JPY H-1
 The USD/JPY 1-hour chart shows price making a bullish push off recent consolidation support, crossing cleanly above both its short-term moving average line and key horizontal pivot near 157.881. Price action is attempting to establish upward momentum toward higher resistance targets. 1. Core Price Action & Structure * Current Price: 157.881 * Immediate Resistance Zone: 158.200 – 158.630 (Major overhead supply area corresponding to recent peak highs). * Immediate Support Zone: 157.340 – 156.910 (Crucial demand region where recent bullish reversal wicks formed). * Moving Average Dynamic: Price has pushed above its short-term moving average line, establishing immediate dynamic support on the 1-hour timeframe. 2. Indicator Confluence * Relative Strength Index (RSI - 14): Currently sitting at 33.15. While lingering near lower levels following the previous downswing, the upward trajectory of price suggests early stages of momentum recovery out of near-oversold bounds. * MACD (12, 26, 9): Positioned at -0.0861 / 0.0264. Histogram bars are beginning to flatten near zero, indicating selling momentum is diminishing as buyers step back in. * Bears Power (13): Reads -0.5018, reflecting declining bearish influence as bulls regain short-term control. 3. Strategic Entry Scenarios Scenario A: Bullish Continuation (Long Entry) * Entry Trigger: A sustained 1-hour candle close above 157.900 or a minor pull-back retest toward 157.800 near moving average support. * Stop Loss: 157.340 (placed safely below immediate support and moving average). * Take Profit Targets: * Target 1: 158.200 * Target 2: 158.630 Scenario B: Bearish Rejection (Short Entry) * Entry Trigger: A 1-hour candle closing firmly back below 157.340, signaling a false breakout and breakdown under support. * Stop Loss: 157.900 (above recent breakout consolidation level). * Take Profit Targets: * Target 1: 156.910 * Target 2: 156.480 Risk Management Note While current price action shows bullish breakout characteristics above 157.881, the overall indicator values warrant caution. Ensure confirmation via full 1-hour candle closes above 157.900 before executing orders to avoid false breakouts. Always maintain a risk-to-reward ratio of at least 1:2.
*The market analysis posted here is meant to increase your awareness, but not to give instructions to make a trade
 Italiano
 Русский
 English
 Bahasa Indonesia
 Bahasa Malay
 ไทย
ไทย Español
 Deutsch
 Български
 Français
 Tiếng Việt
 中文
中文 বাংলা
বাংলা हिन्दी
 Čeština
 Українська
 Română
